Mean Circulation Highlights and Climate Anomalies May through August 2016
Anthony Artusa, Meteorologist, Operations Branch,
Climate Prediction Center NCEP/NWS/NOAA
All anomalies reflect departures from the 1981-2010 base period.
May - June 2016
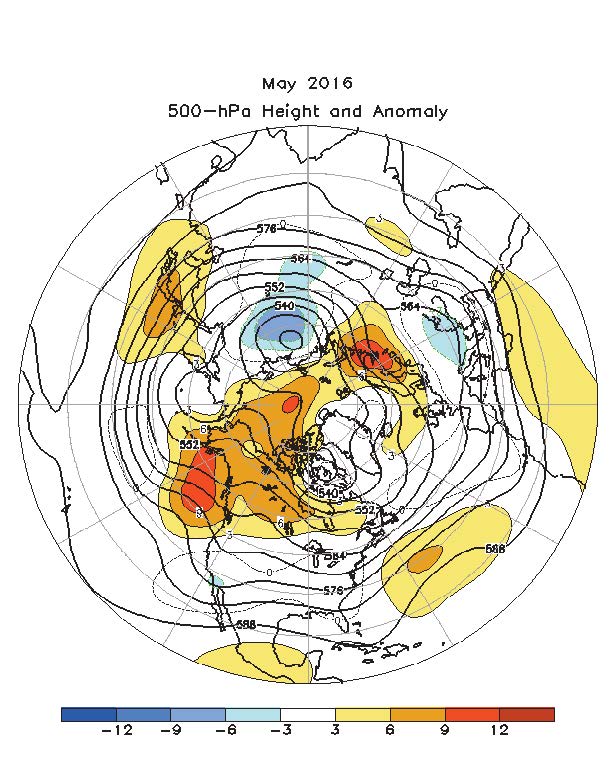
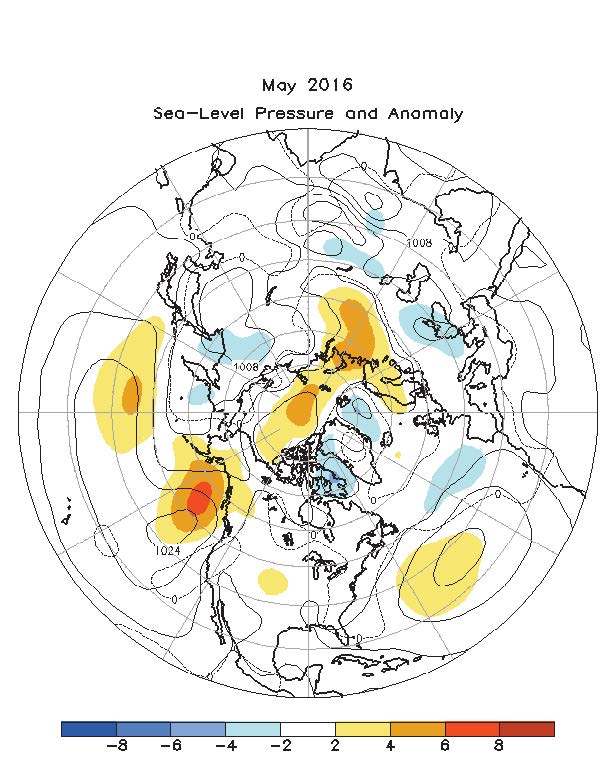
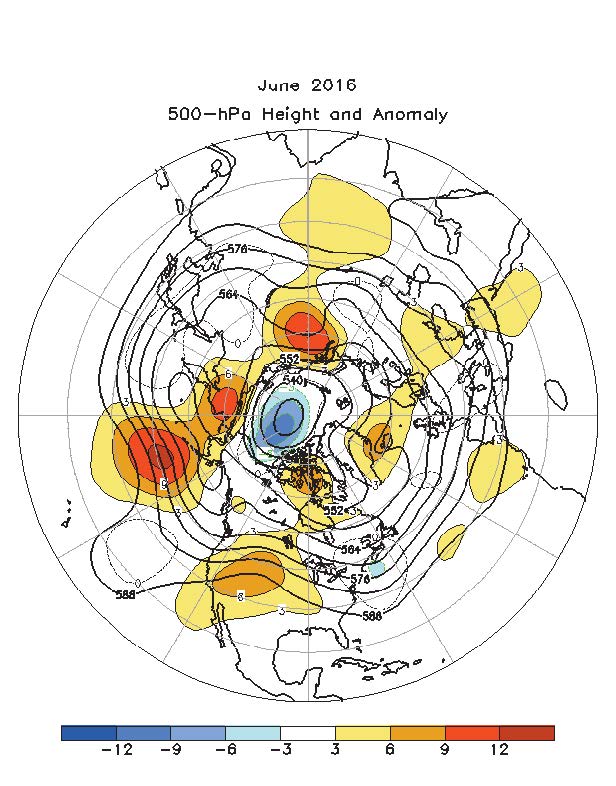
In May 2016, the mid-tropospheric flow pattern featured above average heights over the Gulf of Alaska, Canada, the temperate latitudes of the North Atlantic, and northern Europe Figure 1. Below average heights were observed across much of Siberia, and southeastern Europe. The Sea Level Pressure and Anomaly map (SLPA) mirrored the 500 hPa flow pattern Figure 2. During February, 500 hPa heights were above average across the subtropical North Pacific, western North America, the North Atlantic, and from the eastern Mediterranean region to central Asia, continuing northward to (and including) the Arctic Ocean Figure 3.
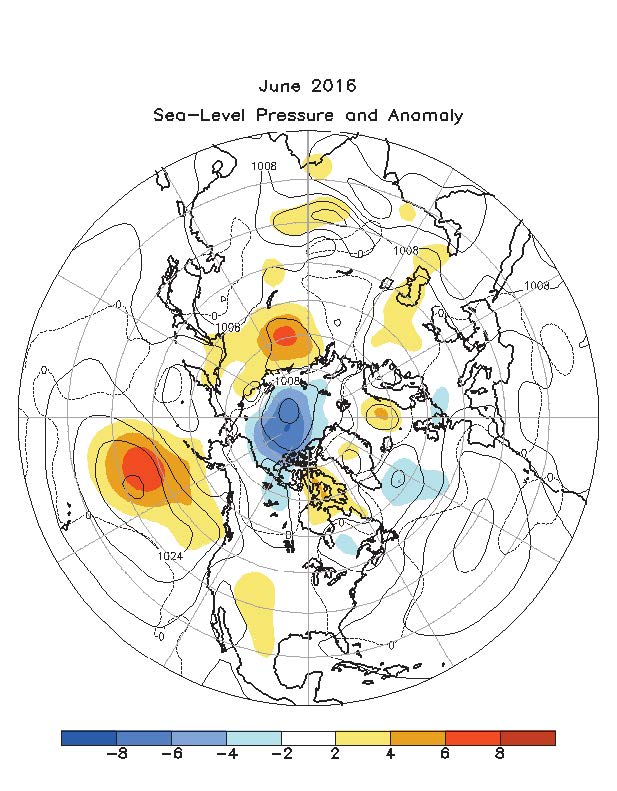
In June, the 500 hPa flow pattern was characterized by above average heights from the north central Pacific to extreme eastern Siberia, north central Russia, the western contiguous U.S., and the high latitudes of the North Atlantic Figure 3. Below average heights were mostly confined to the north of Alaska, covering about one half of the Arctic Ocean. The SLPA pattern resembled the 500 hPa height anomaly pattern Figure 4.
The Tropics
During May and June, sea surface temperatures (SSTs) were near average across the central and eastern equatorial Pacific. The monthly Nino 3.4 indices were +0.3C in May and -0.1C in June. The depth of the oceanic thermocline (measured by the depth of the 20C isotherm) was below average in the central and eastern during the 2 month period. Low level (850 hPa) and upper level (200 hPa) wind anomalies were close to long term averages across the central and eastern equatorial Pacific in both May and June. Convection was also close to average across the equatorial Pacific during this two month period. Collectively, these oceanic and atmospheric anomalies are consistent with a transition from El Nino to ENSO Neutral conditions.
During May and June, there were a total of five Tropical Storms around the globe, with three in the northern Atlantic Ocean and two in the northern Indian Ocean. In the Atlantic basin, Tropical Storm Bonnie briefly affected the South Carolina coast, but remained mostly off the Southeast U.S. coast. Colin tracked from the northern Yucatan to the central Florida Panhandle and Georgia coast, while Danielle appeared for a brief time over the Bay of Campeche. In the northern Indian Ocean, Tropical Storm Roanu affected the northwest Bay of Bengal, while Tropical Storm Two influenced the northern Arabian Sea.
June - August 2016
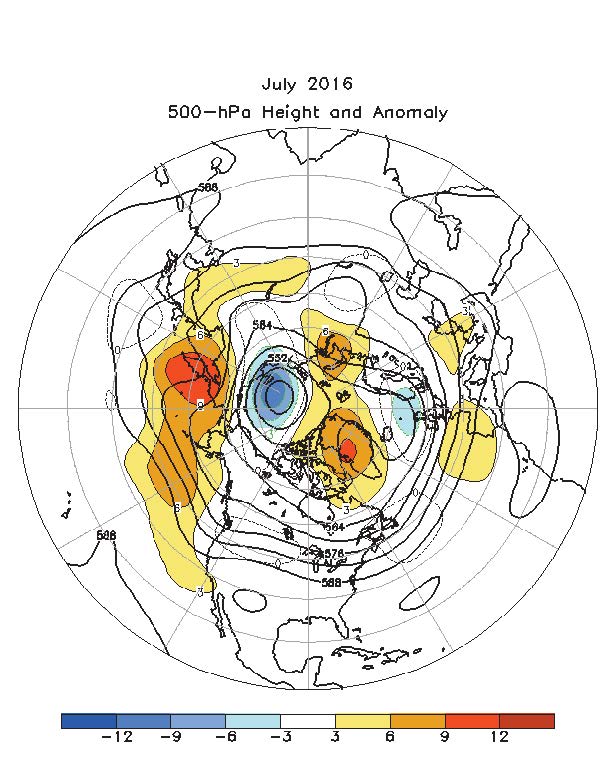
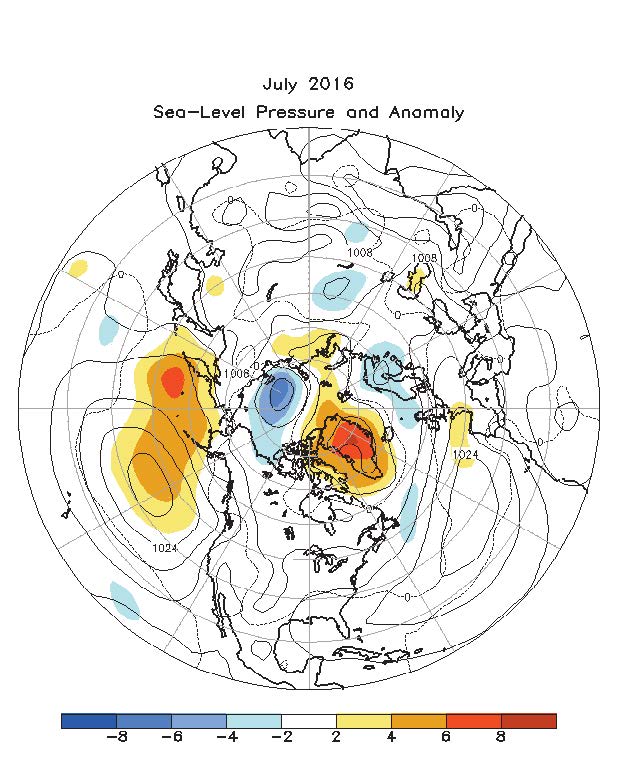
During July, the 500 hPa circulation was characterized by above average heights across the high latitudes of the North Pacific, Greenland, and in the vicinity of the Russian arctic island of Novaya Zemlya Figure 5. Below average heights were observed over the Arctic Ocean bordering the Siberian coast, and near Scandinavia. The SLPA pattern roughly resembled the associated mid tropospheric height anomaly pattern Figure 6.
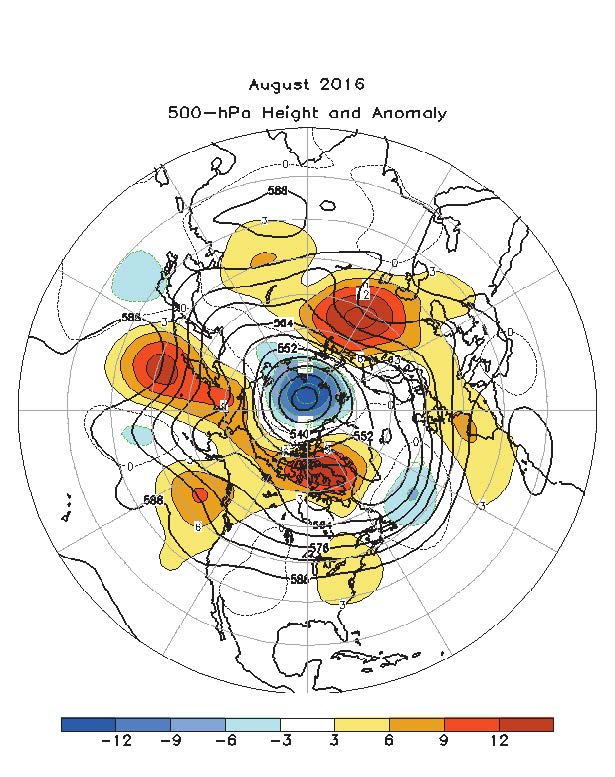
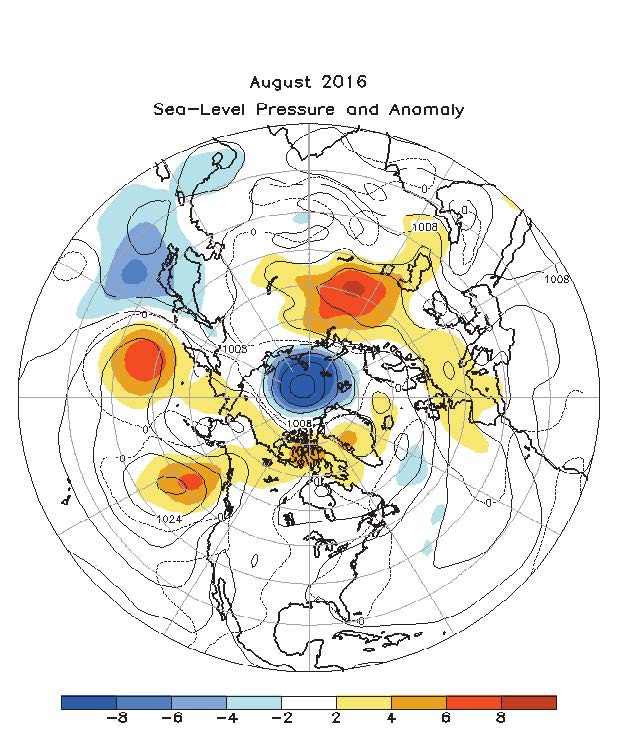
The mean circulation pattern in August featured above average heights over western and eastern portions of the North Pacific, northern Alaska and northern Canada, and western Russia Figure 7. Below average heights were generally limited to the vicinity of the North Pole, and the mid to high latitudes of the North Atlantic. Once again, the SLPA pattern mirrored the 500 hPa height anomaly pattern Figure 8.
The Tropics
SSTs across portions of the central and eastern equatorial Pacific continued to be near average during July, though slightly below average in August. The monthly Nino 3.4 indices were -0.5C for both months. The depth of the oceanic thermocline remained below average in the central and eastern equatorial Pacific during the two month period, and sub surface temperatures ranged from 1-3C below average. Low level (850 hPa) wind anomalies remained near average over this region during the period. Upper level (200 hPa) wind anomalies remained near average in July, but became westerly east of the Date Line in August. Deep tropical cloudiness and related thunderstorm activity was suppressed over the central Pacific in July, and suppressed over the western and central Pacific in August. Collectively, these oceanic and atmospheric anomalies are consistent with ENSO Neutral conditions.
Across the global tropics, the Madden Julian Oscillation (MJO) became increasingly weak and incoherent during the two month period Reference 1. In a simplistic sense, the MJO can be thought of as alternating regions of rising and sinking motion that circumnavigates the global tropics in about 30-60 days. The enhanced phase of the MJO (associated with rising motion and convection) has been concentrated in the general vicinity of the Maritime Continent, especially in August. The MJO is an important topic for study, as it can have a significant influence on the development and intensity of tropical cyclones and monsoon systems. The MJO signal is often masked by higher frequency intraseasonal signals such as Kelvin Waves, and lower frequency signals such as equatorial Rossby Waves.The enhanced convection centered in the vicinity of the Maritime Continent is a reflection of constructive interference between the evolving background state (ENSO Neutral) and the negative phase of the Indian Ocean Dipole (IOD). The negative IOD phase is typically associated with unusually warm SSTs, rising motion, and increased convection across the eastern Indian Ocean and Maritime Continent region.
References
1. (MJO): http://www.cpc.ncep.noaa.gov/products/precip/CWlink/MJO/ARCHIVE/PDF/
Much of the information used in this article originates from the Climate Diagnostics Bulletin archive: ((http://www.cpc.ncep.noaa.gov/products/CDB/CDB_Archive_html/CDB_archive.shtml))
Back to top