Marine Weather Review - North Pacific Area September to December 2015
George P. Bancroft Ocean Forecast Branch, Ocean Prediction Center, College Park, MD NOAA National Center for Environmental Prediction
Introduction
The weather pattern over the North Pacific was most active at the end of September and October with the heavy weather season off to an early start, starting with a hurricane force event in the eastern Pacific late in September and an unusually intense low with a pressure down to 948 hPa in the far west. There were eight hurricane force lows in October including ones with tropical origin, and five each in November and December. There was a period in late October when three such events were occurring at the same time. The most intense systems moved from the western waters near Japan or the Kurile Islands to the Bering Sea or along or just south of the Aleutian Islands and toward eventual weakening over Alaska or the Gulf of Alaska. Some of the significant events originated over the south central waters and contributed to the occurrence of some hurricane force events in the northeast Pacific. The most significant event of the period was the cyclone that developed a 924 hPa central pressure near the central Aleutian Islands in December, matching the pressure reached in the post tropical Nuri event in November 2014 (Reference 6).
There was considerable tropical activity including contributions from the Central Pacific which experienced record activity. There were 12 named systems, with four coming from the Central Pacific, but there was only one super typhoon (with sustained winds of 130 kt or higher). Two of the cyclones, in October, became powerful extratropical lows as they recurved into the mid-latitude westerlies.
Tropical Activity
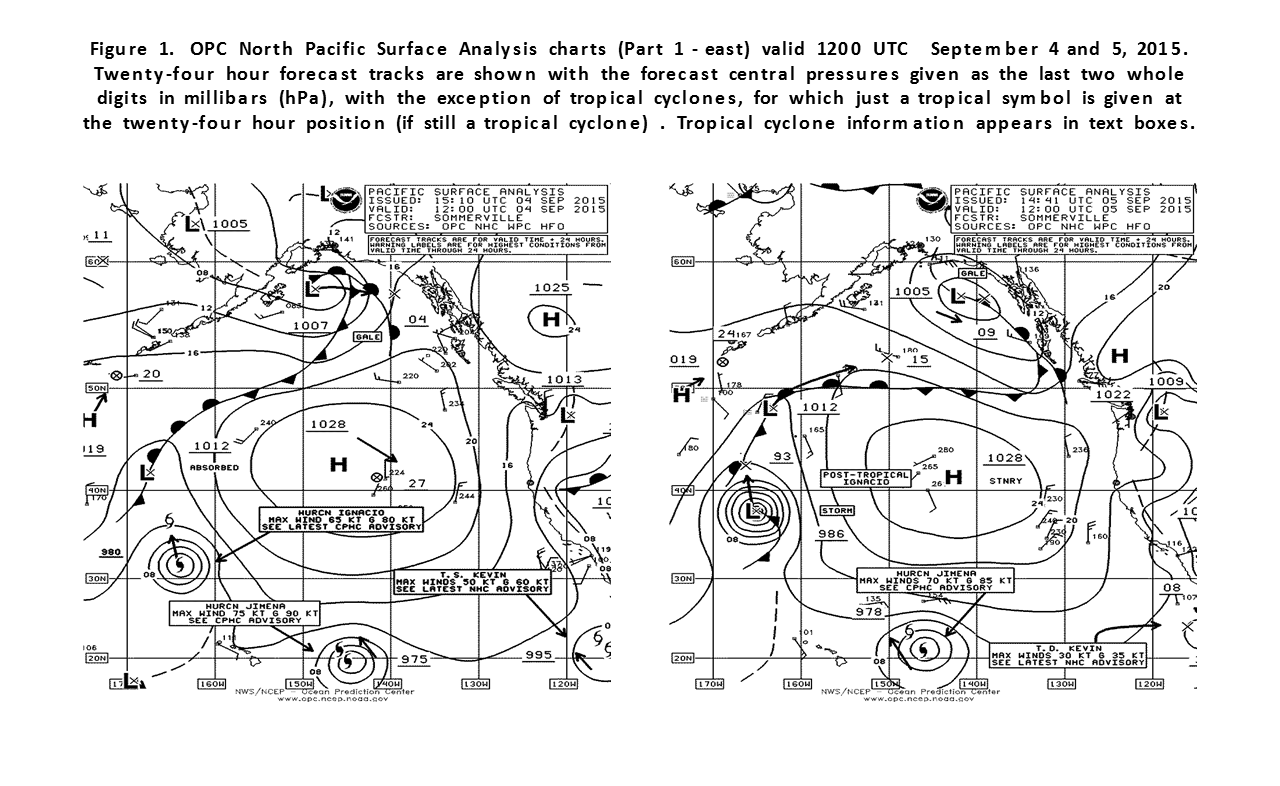
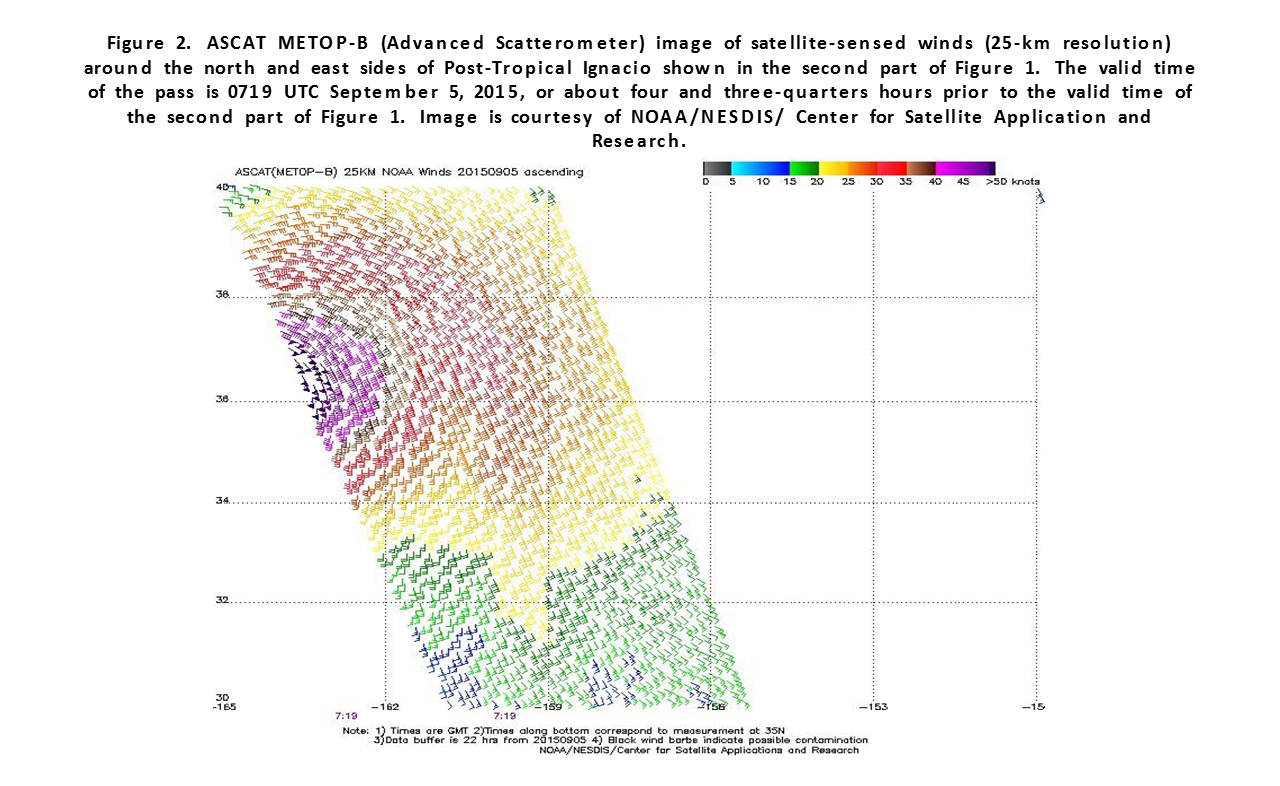
Hurricane Ignacio: Unusually warm Central Pacific water allowed Ignacio, which originally came from the eastern Pacific (east of 140W) to move north into OPC's high seas area near 30N 164W as a hurricane with 65 kt sustained winds early on September 4th. As Ignacio moved north it became a post-tropical storm force low by the 5th (Figure 1). The ASCAT imagery in Figure 2 covering only the east side of the cyclone indicates a core of storm force winds close to the center which is just outside the data swath. The cyclone continued to move slowly north through the 6th before turning northeast as a gale on the 7th and dissipating near the Canadian coast on the 9th.
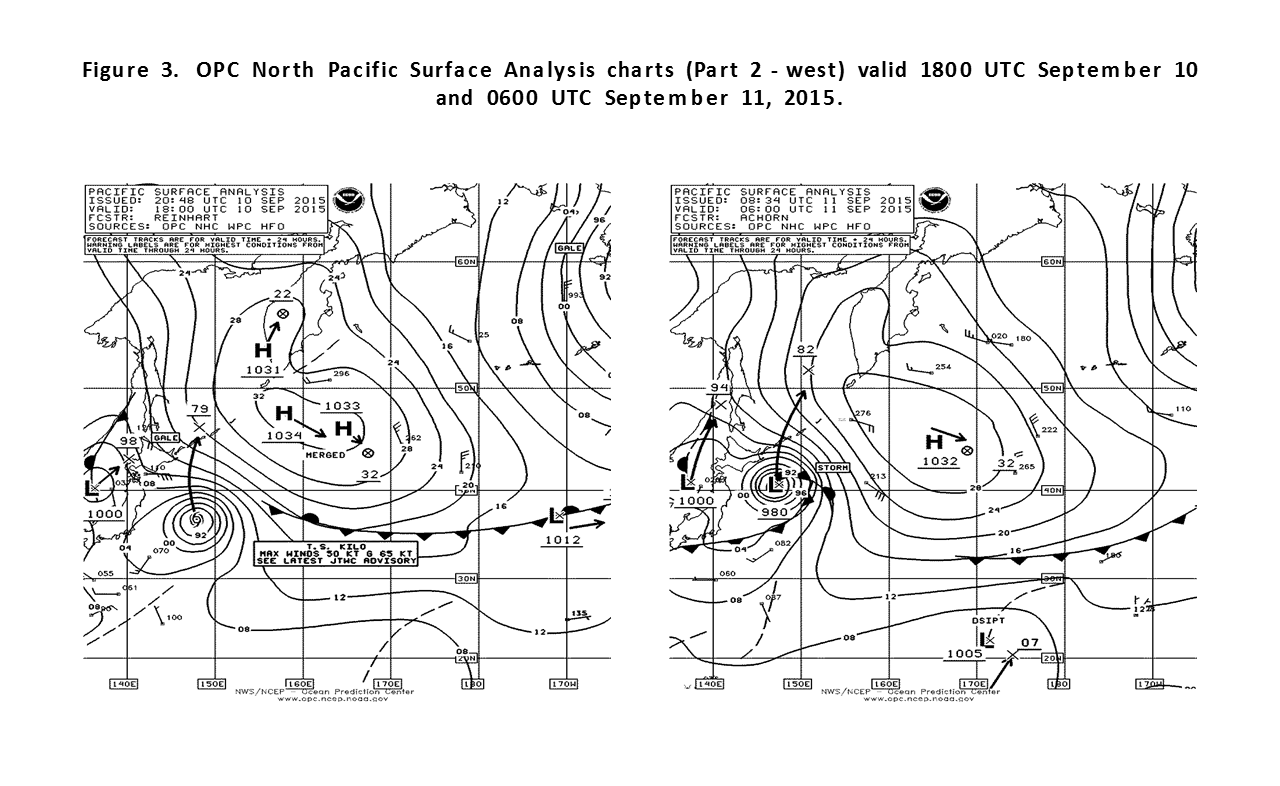
Typhoon Kilo: Kilo crossed 180W as September began and was a major but weakening hurricane with sustained winds of 105 kt, tracking west northwest from 23N 180W. It weakened to a tropical storm on the 9th. Figure 3 depicts Kilo transitioning to an extratropical storm. An ASCAT (METOP-B) pass from 1200 UTC on the 1th returned partial coverage and showed winds to 45 kt on the northeast side when the center was east of Hokkaido, Japan. Post-Tropical Kilo weakened to a gale the next day, passed inland OVER Russia late on the 12th, and then dissipated over Alaska on the 14th.
Tropical Storm Etau: Etau originated as T.D. 18W near 21N 139E at 1800 UTC on the 6th and became a tropical storm six hours later. Etau became strongest with sustained winds of 55 kt near the southern coast of Japan at 1800 UTC on the 8th. After crossing into the Sea of Japan Etau weakened to a post tropical gale early on the 9th and then moved north and inland late on the 11th.
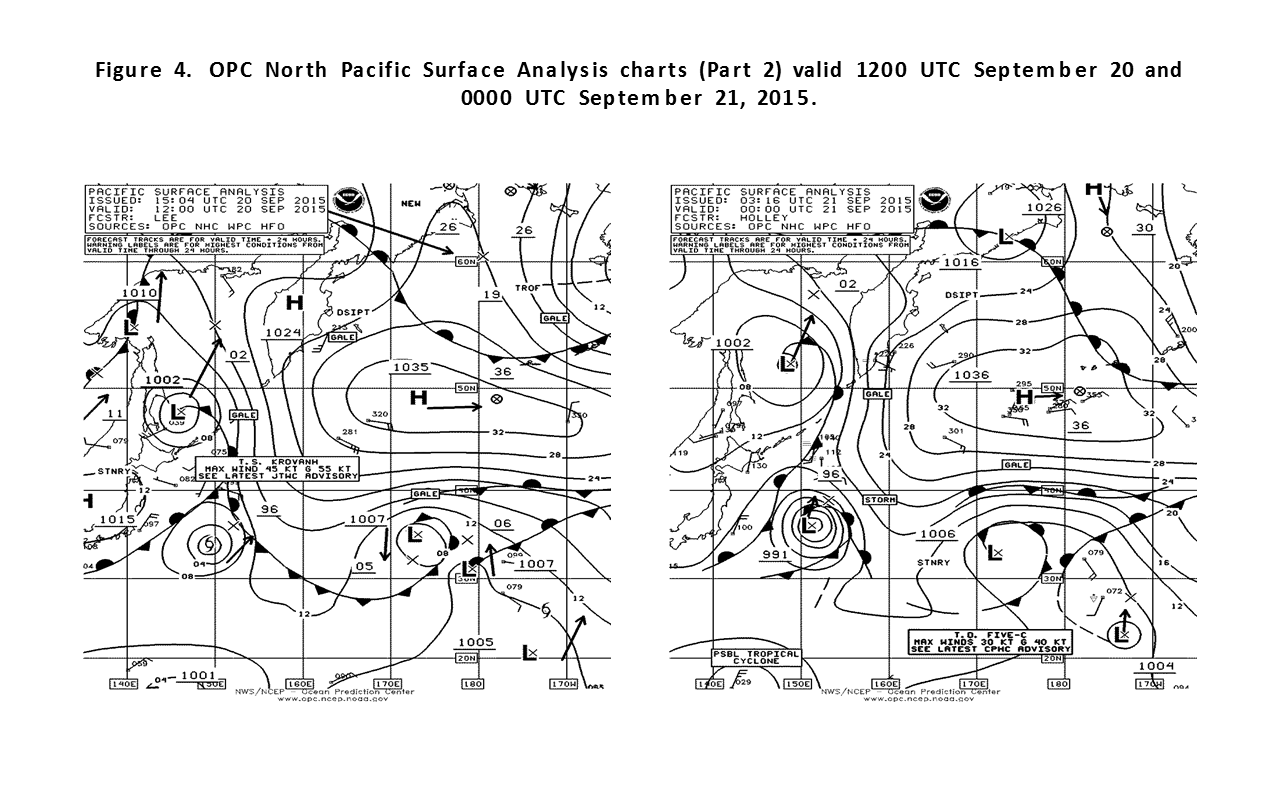
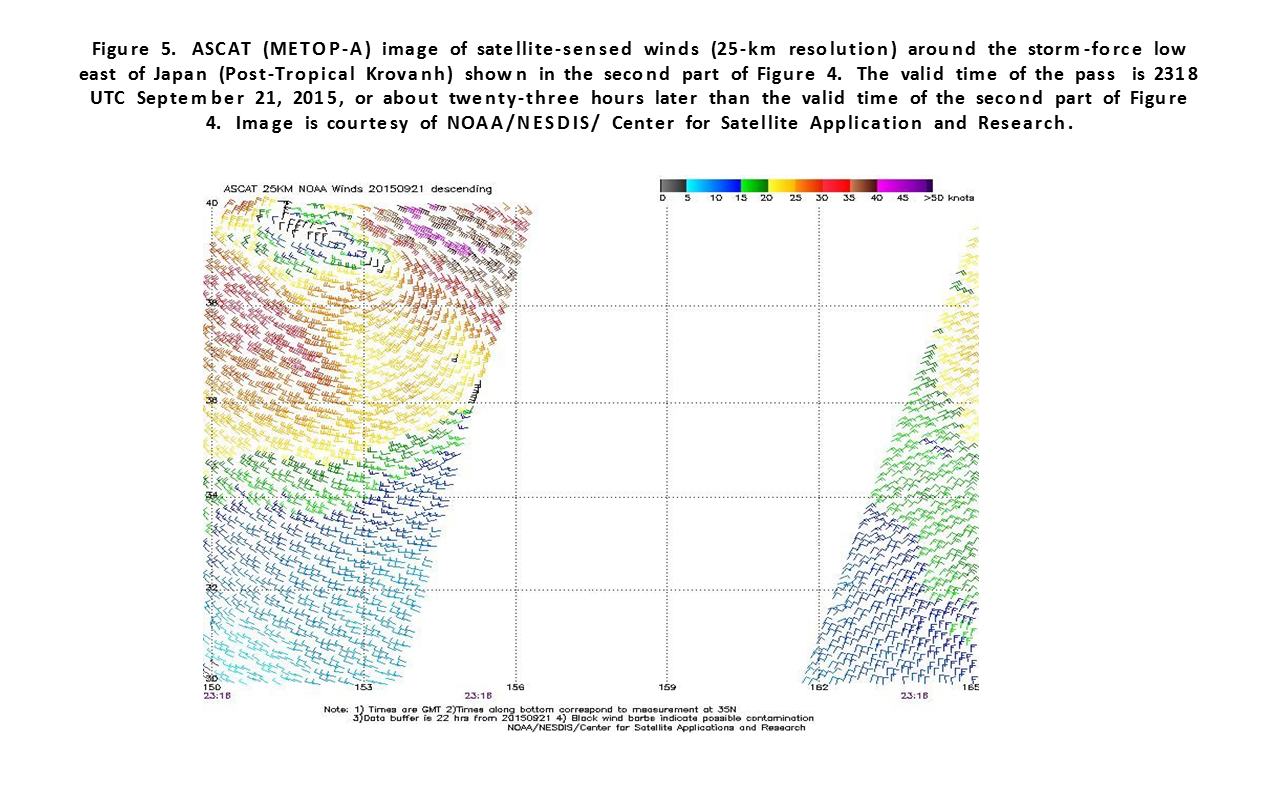
Typhoon Krovanh: T.D. 20W forming near 18N 151E late on September 14th moved northwest and intensified to Typhoon Krovanh early on the 18th , and briefly to a major typhoon late on the 17th near 24N 143E with sustained winds of 105 kt. A weakening trend then set in as the cyclone began to recurve to the northeast. Figure 4 shows transition over a 12 hour period to a post tropical storm force low. The ASCAT image in Figure 5 returned winds to 45 kt mainly on the northeast side. A small negative bias at those wind speeds suggests Krovanh as having marginal storm force winds. Post Tropical Krovanh then stalled east of northern Japan for several days with a weakening trend before dissipating by the 26th.
Tropical Storm Malia: Malia was another Central Pacific system which moved north toward OPC's high seas marine area. It appears as T.D. 5-C in Figure 4. It became Tropical Storm Malia with 35 kt sustained winds reaching 29N 173W at 1200 UTC September 22nd before becoming extratropical and absorbed late on the 22nd.
Tropical Storm Dujuan: T.D. 21W formed near 16N 140E at 1800 UTC September 21st and drifted north while becoming Tropical Storm Dujuan 0000 UTC on the 23rd with sustained winds of 40 kt. Dujuan reached 136E six hours later and passed west of the area, eventually become a typhoon west of the area two days later.
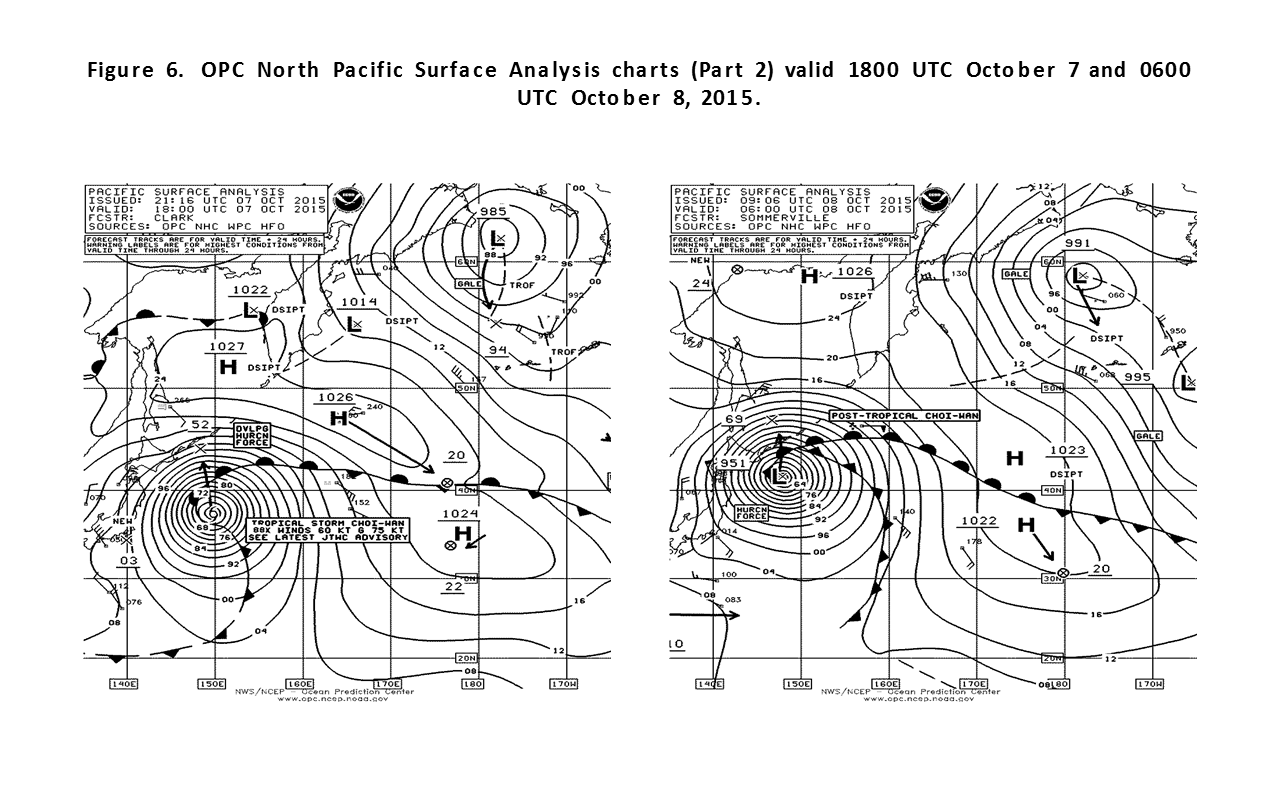
Typhoon Choi-Wan: Tropical Storm Choi-Wan formed from a non-tropical gale near 18N 168E 0600 UTC October 2nd and moved northwest, becoming a typhoon near 24N 151E late on the 5th. It peaked at only 70 kt before weakening to a strong tropical storm early on the 7th. Figure 6 shows the transition of its large circulation into an intense post-tropical hurricane force low over a 12 hour period. The ASCAT-B pass reveals circulation on the north side of the cyclone with winds to 60 kt. A Rapidscat pass from none hours later revealed winds to 70 kt from the west to northwest. The Simushir (UBRI5) reported north winds of 60 kt near 49N 144E at 1800 UTC on the 8th. The Hatsu Excel (VSXV3) near 47N 161E encountered east winds of 40 kt and seas 11.3 meters (37 feet) at that time. The cyclone then moved slowly north into the Sea of Okhotsk and weakened, with its winds diminishing to gale force on the 9th.
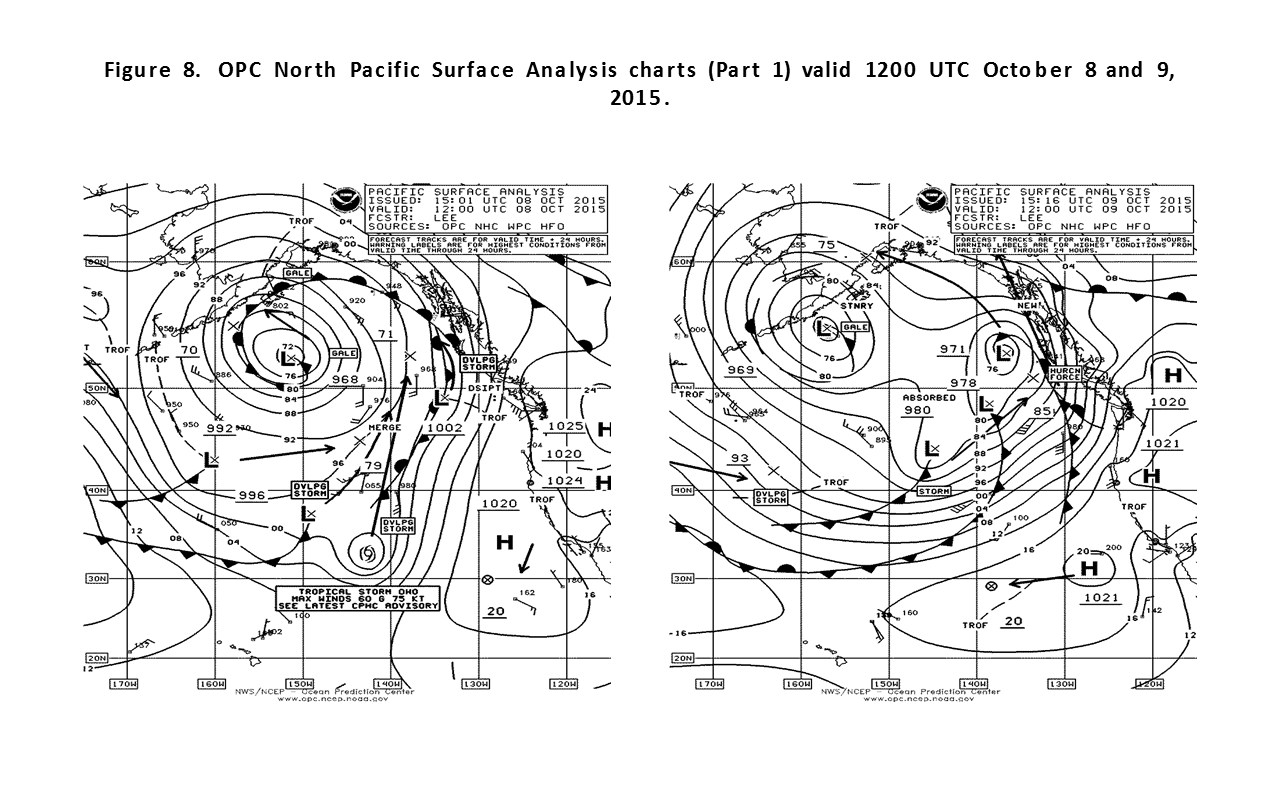
Hurricane Oho: Oho was another Central Pacific system that moved north into OPC's high seas area as depicted in Figure 8. Between 0000 UTC and 0600 UTC October 8th Oho crossed 30N as a hurricane with sustained winds 75 kt lowering to 65 kt, and further weaken to a tropical storm occurred six hours later and to a post-tropical gale at 1800 UTC on the 8th. Re-intensification followed as the center passed west of the Canadian coast with brief hurricane force conditions and then reaching the Gulf of Alaska with a 962 hPa center on the 9th, but top winds were down to gale force. It then dissipated over southwestern Alaska the next day. The Bremen Express (DHBN) near 48N 131w reported south winds of 45 kt and 8.2 meter seas (27 feet) at 1800 UTC on the 9th.
Tropical Storm Koppu: T.D. 24-W formed near 16N 143E at 0000 UTC October 13th and moved west and became Tropical Storm Koppu six hours later with sustained winds of 40 kt. Koppu then passed west of 136E late on the 13th while slowly strengthening.
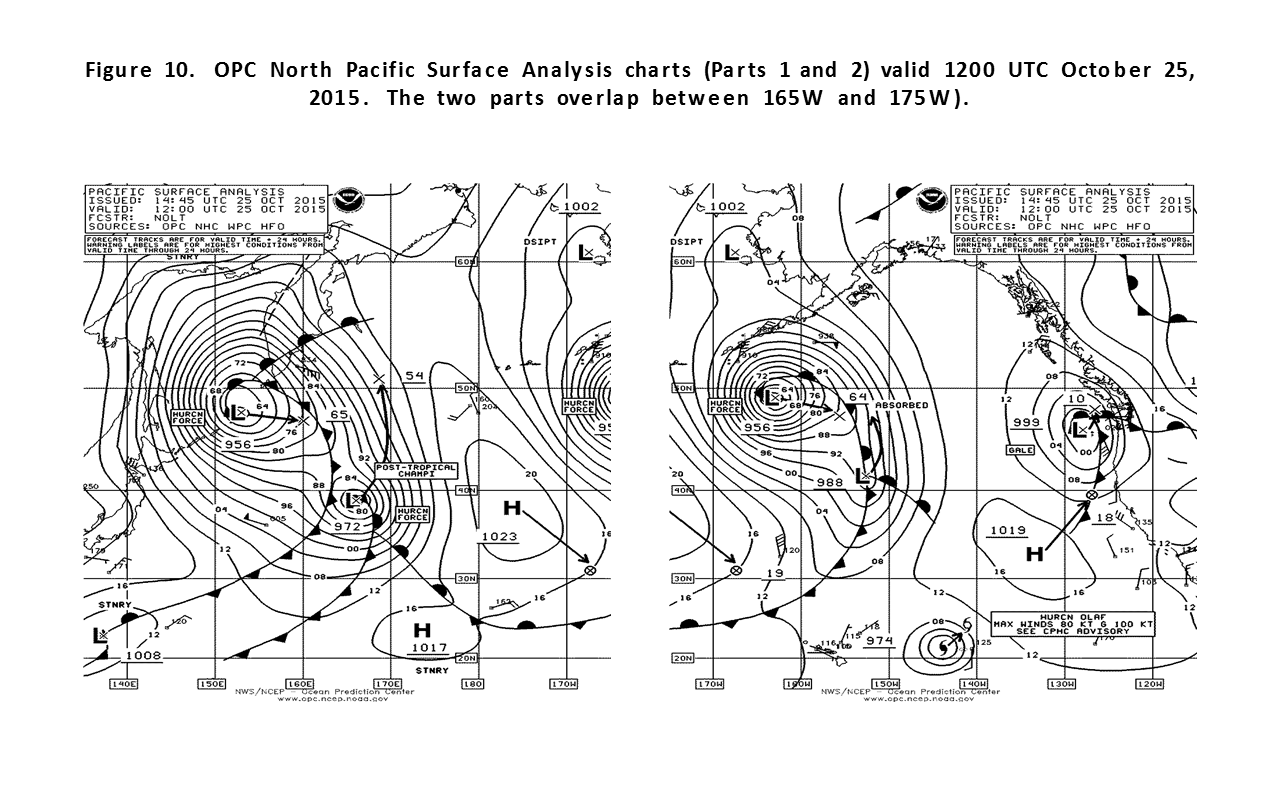
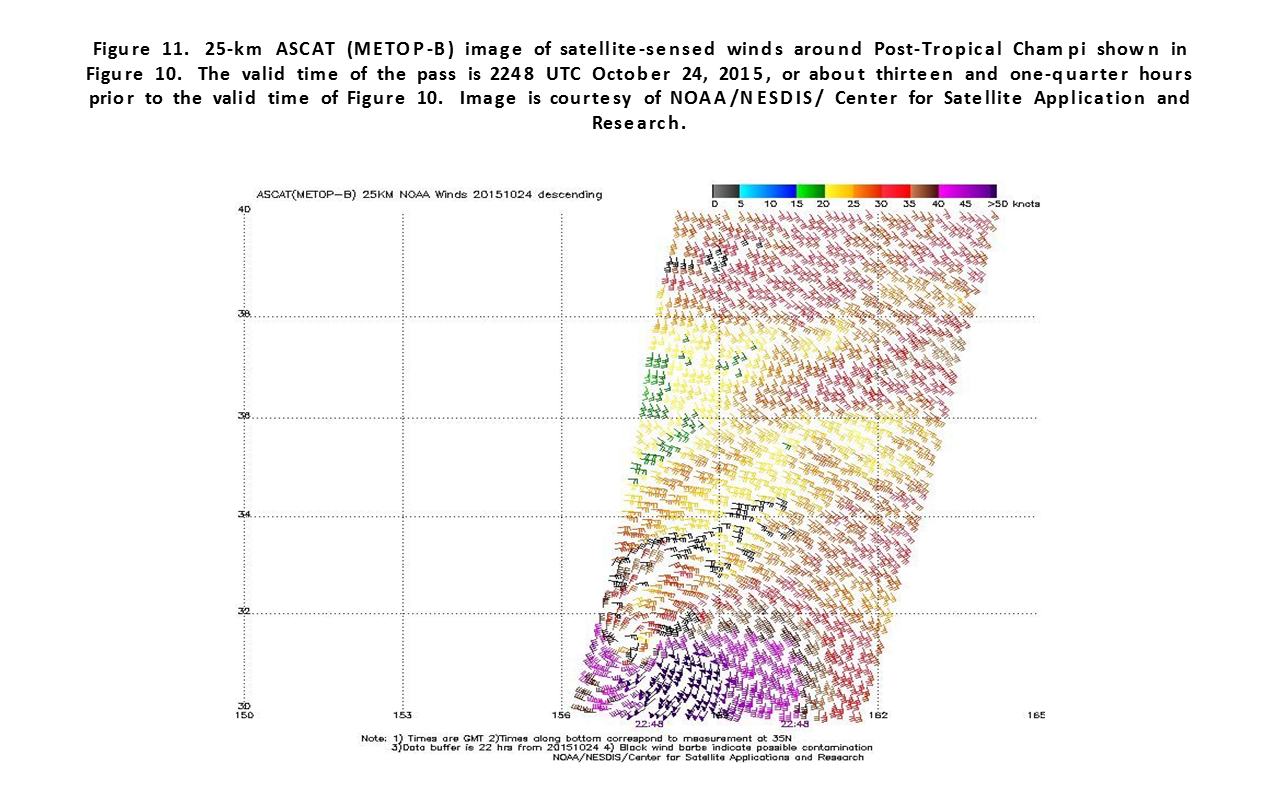
Tropical Storm Champi: T.D. 25-W which became Champi formed near 13N 160E early on the 13th and moved northwest while intensifying. Champi became a typhoon early on the 16th with 65 kt sustained winds near 16N 144E and briefly a super typhoon at 1200 UTC on the 18th with sustained winds of 130 kt and would by a strong Category 4 on the Saffir-Simpson scale (Reference 4). A weakening trend set in as the system passed west of the area late on the 19th. The typhoon then recurved back into the waters southeast of Japan on the 23rd. Figure 9 and Figure 10 depict the transition of Tropical Storm Champi to a strong post tropical low with hurricane force winds over a 24 hour period. Figure 11 reveals a rather compact pattern of stronger winds to 60 kt close to the center, at times seen in former tropical systems. The post tropical low then moved northeast and weakened to a gale on the 26th and dissipated in the southwest Gulf of Alaska by the 28th.
Tropical Storm In-Fa: In-Fa was formerly a typhoon southwest of the area. It moved northeast into OPC's radiofacsimile chart area near 20N 136E with sustained winds of 45 kt at 0600 UTC November 25th. It was the only November storm. The cyclone weakened and became post tropical at 1200 UTC on the 26th near 26N 142E and merged with a front.
Other Significant Events of the Period
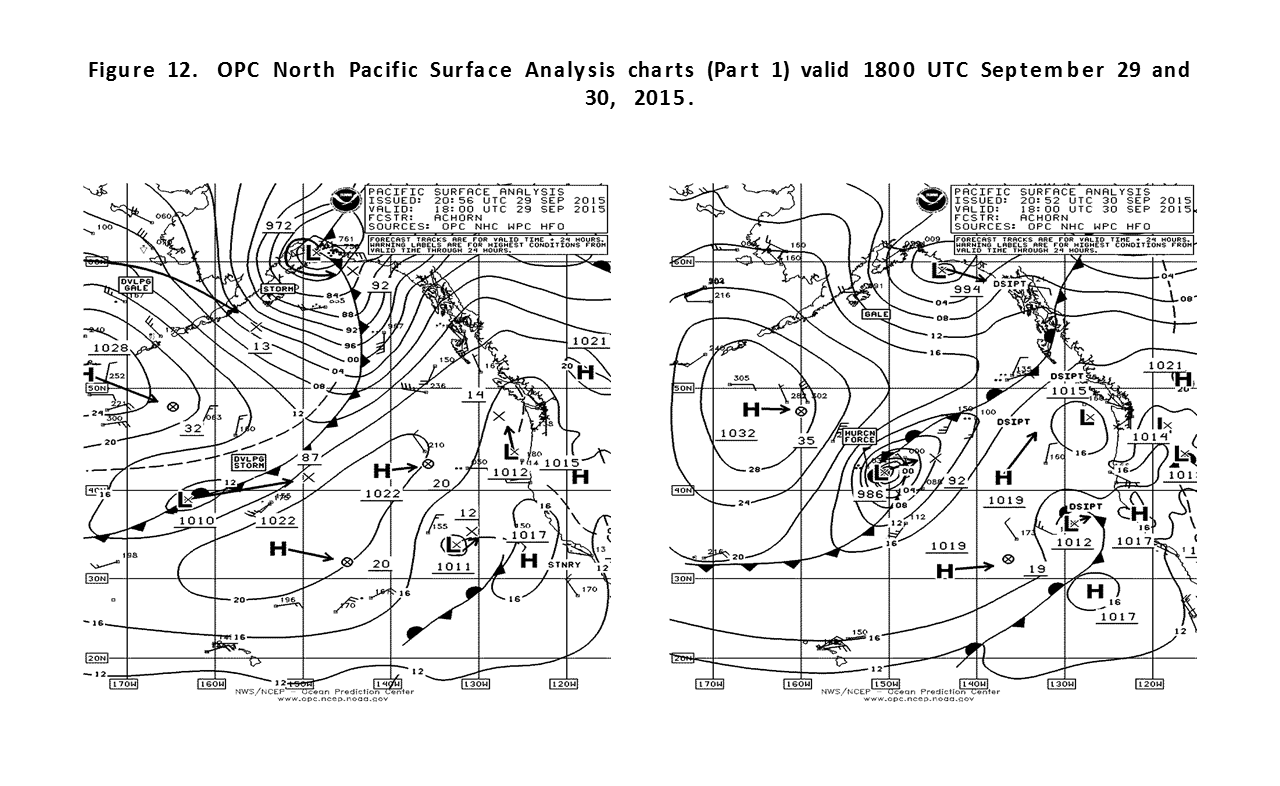
Eastern North Pacific Storm, September 29-October 1: Figure 12 displays the development of the first hurricane-force extratropical low of the fall season. The central pressure fell 24 hPa during the 24 hour period covered by this figure, impressive for that relatively low latitude. The Polar Adventure (WAZV) near 42N 153W reported north winds of 72 kt and the SHIP (41N 151W) encountered southwest winds of 36 kt and 6.7 meter seas (22 feet) at 1200 UTC on the 30th. The cyclone then drifted northeast and its winds weakened to gale force late on October 1ST. It then turned back to the southwest on the 2nd and became absorbed.
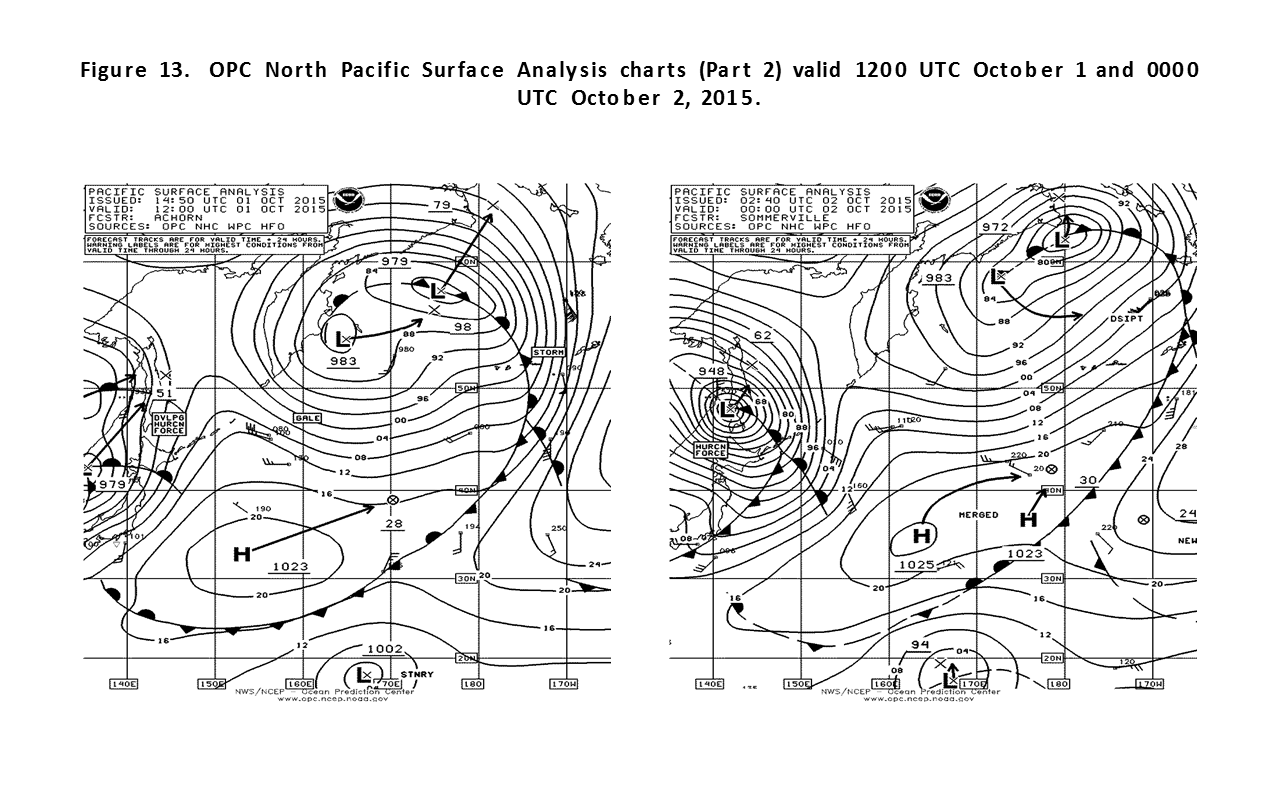
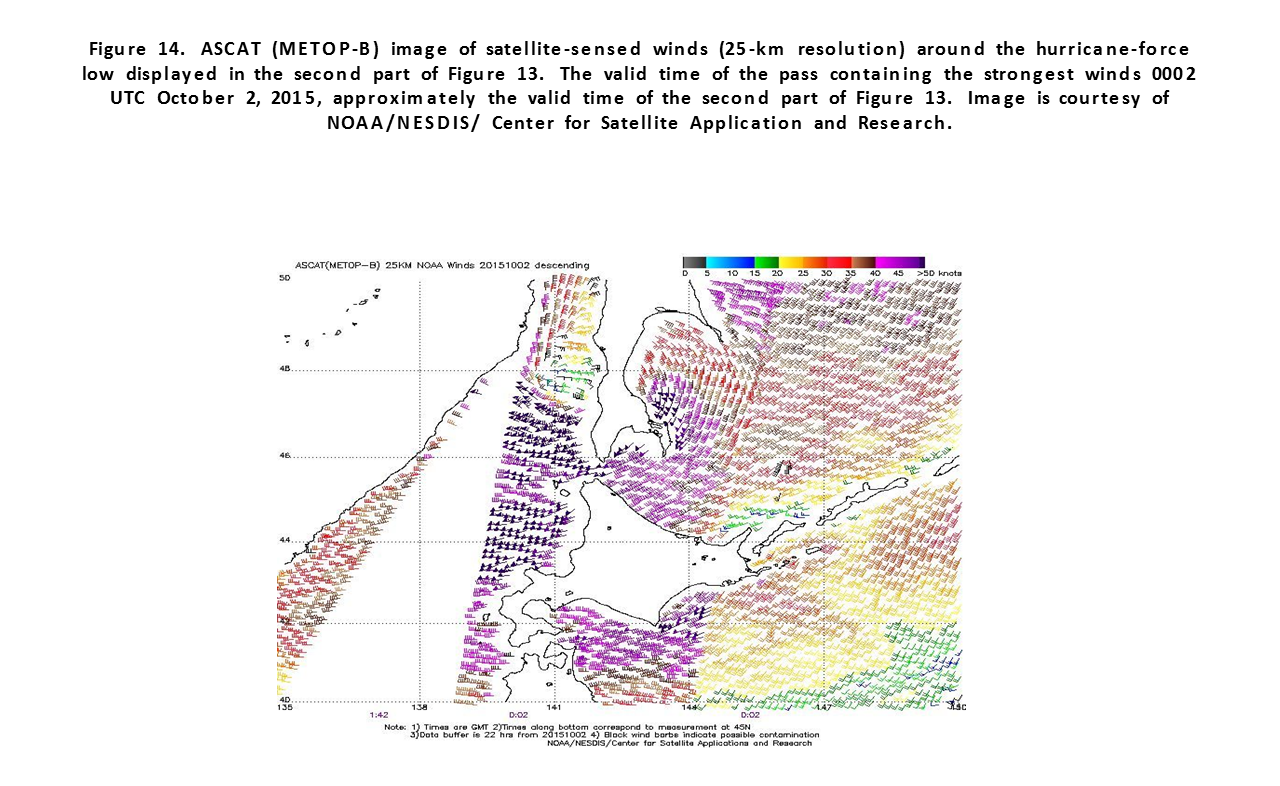
Northwest Pacific Storm, October 1-2: The explosive development of this system is shown in Figure 13. The initial development was over land and the developing center was at 40N 131E with a 988 hPa pressure at 0600 UTC on the 1st. This gives an 18 hour drop in pressure of 40 hPa. This cyclone was the only one with a central pressure below 950 hPa during the period other than in December. The ASCAT-B imagery in Figure 14 returned 50 to 70 kt winds mainly in the northern Sea of Japan. The Savannah Express (DNDD) reported south winds of 45 kt and 5.2 meter seas (17 feet) near 35N 150E at 0300 UTC on the 2nd. A vessel with the SHIP callsign encountered southwest winds of 40 kt and 7.9 meter seas (26 feet) at 0600 UTC on the 2nd. The cyclone then moved into the Sea of Okhotsk the next day where it stalled and weakened through the 3rd.
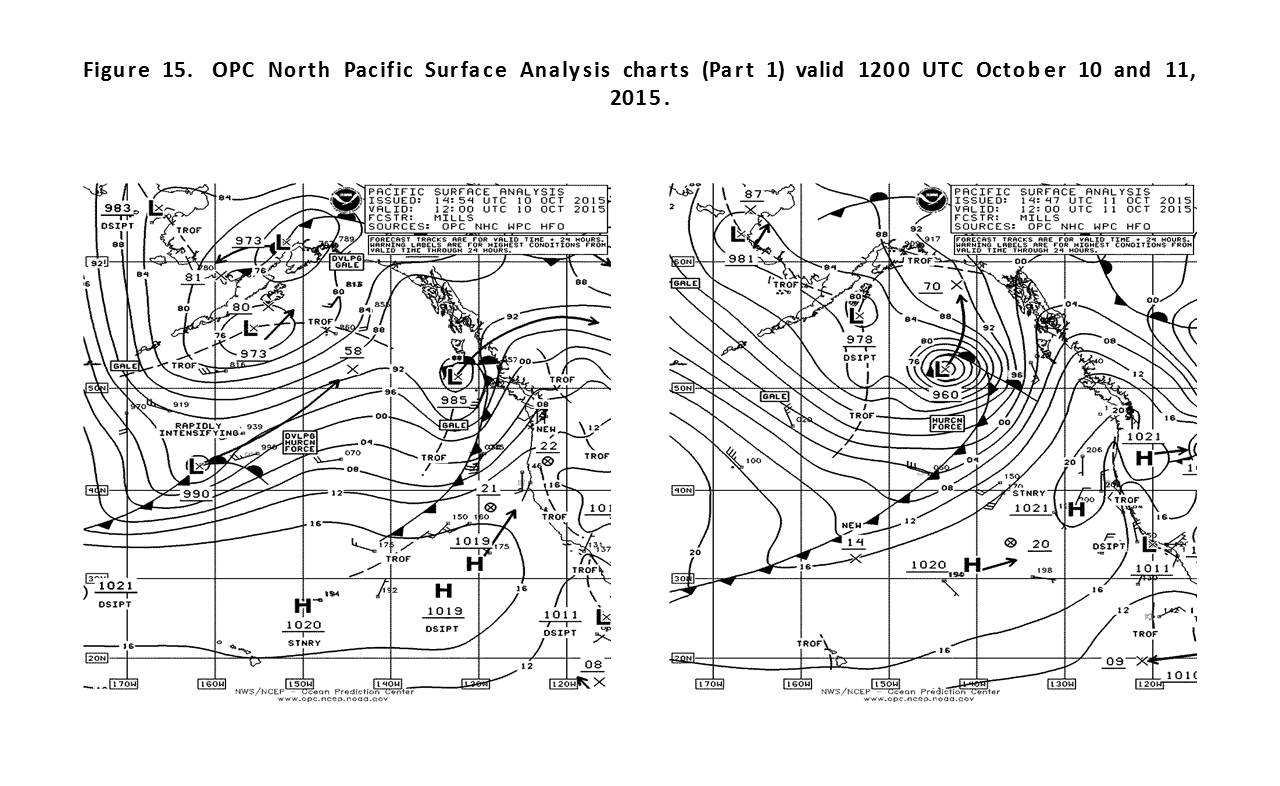
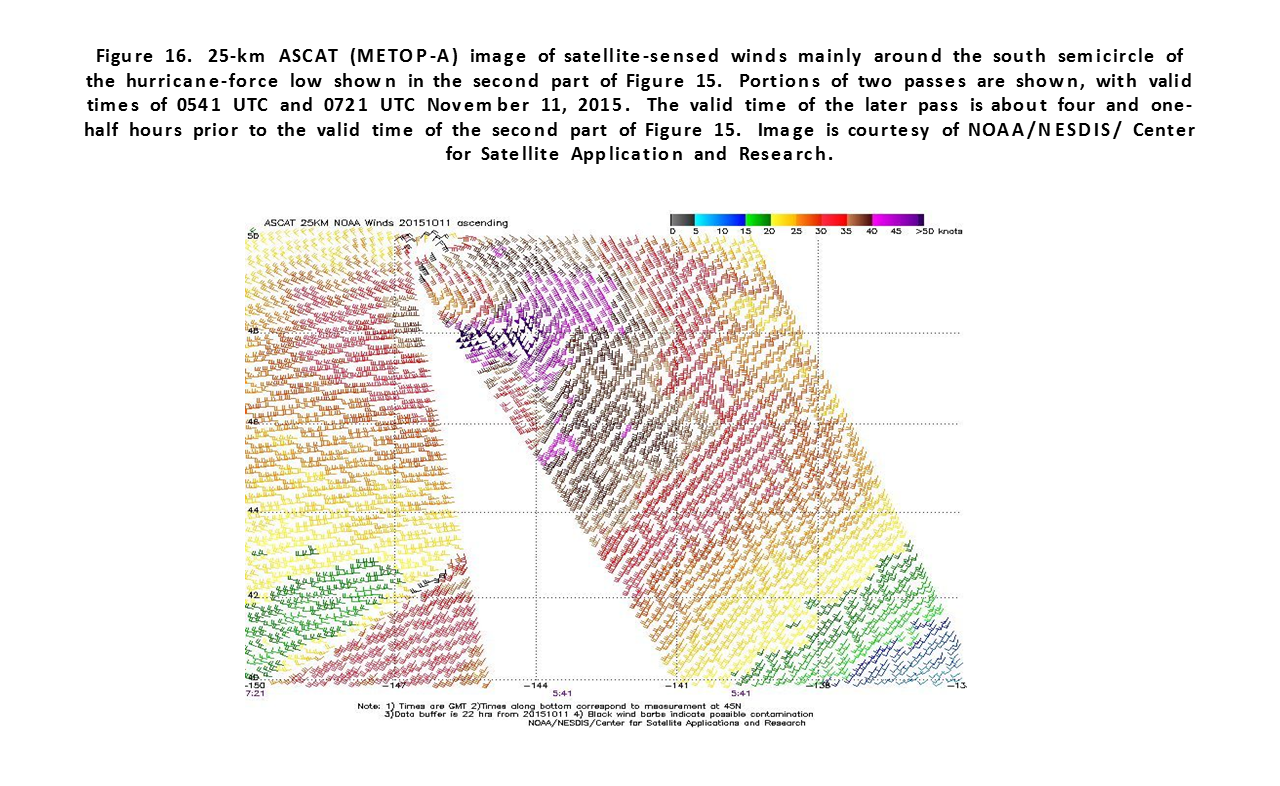
Eastern North Pacific Storm, October 10-12: Figure 15 depicts the development of this hurricane force low from a rapidly intensifying frontal wave over a 24 hour period. It originated in the central waters south of the eastern Aleutian Islands early on the 9th. The central pressure fell 30 hPa in the 24 hour period covered by Figure 15. The ASCAT-A image in Figure 16 reveals a well-defined center and an area of winds 50 to 60 kt on the southeast side. The Stikine (WDC8583) near 55N 132W reported southeast winds of 55 kt at 1800 UTC on the 11th. Buoy 46184 (53.9N 138.9W) reported southwest winds of 43 kt with gusts to 52 kt and 10.5 meter seas (34 feet) at 2100 UTC on the 11th. The cyclone subsequently moved north into the Gulf of Alaska where it dissipated late on the 12th.
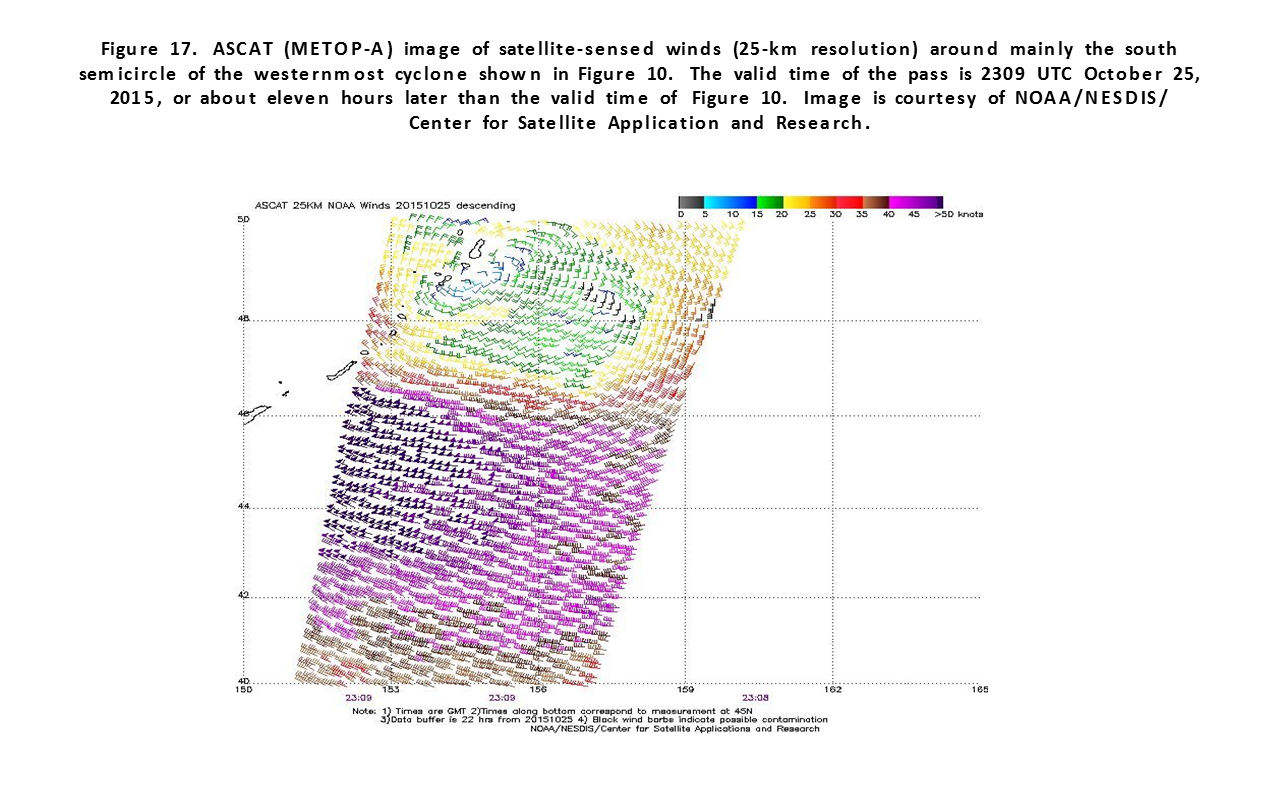
Northwest Pacific Storm, October 23-27: Referring back to Figure 9 and Figure 10, low pressure rapidly developed to the northwest of Champi. Its central pressure fell 32 hPa in the 24 hour period ending at 1200 UTC on the 25th. The ASCAT image in Figure 17 reveals winds 50 to 60 kt on the south side of the system. The Star Japan ( LAZV5) near 45N 149E reported northwest winds of 55 kt and 7.0 meter seas (23 feet) at 0100 UTC on the 25th. The Tokyo Express (DGTX) near 37N 145E encountered northwest winds of 50 kt and 9.0 meter seas at 0000 UTC on the 25th. The system then moved east and dissipated south of the central Aleutians on the 28th.
North Pacific Storm, October 24-26: In Figure 9 and Figure 10 the complex area of low pressure over the central waters consolidated and rapidly deepened over the 24 hour period covered by the figures. The central pressure fell 42 hPa in the same period. The lowest central pressure, 952 hPa, occurred six hours later. The Horizon Anchorage (KGTX) reported east winds of 50 kt and 7.9 meter seas (26 feet) near 54N 152W at 0600 UTC on the 26th. Buoy 46066 (52.8N 155.0W) reported east winds of 41 kt with gusts to 52 kt and 9.0 meter seas (30 feet) 0500 UTC on the 26th. The cyclone subsequently moved to the Gulf of Alaska by the 28th where it weakened and became stationary.
North Pacific and Bering Storm, November 3-6: A wave of low pressure moved northeast from south of Japan on November 1ST and developed hurricane force winds and a lowest central pressure of 961 hPa near the central Aleutians by 1800 UTC on the 4th. The central pressure fell 37 hPa in the 24 hour period ending at 1200 UTC on the 4th. At 0821 UTC November 4 ASCAT-B pass returned 50 to 65 kt winds in the south semicircle when the center was still south of the Aleutians. The Amarantha (VRBB3) near 55N 179W reported north winds of 48 kt and 10.4 meter seas (34 feet) at 2100 UTC November 4th. Buoy 46072 (51.7N 172.2W reported southwest winds of 43 kt with gusts to 56 kt and 8.0 meter seas (26 feet) at 1900 UTC on the 4th and a peak gust of 60 kt nine hours later. Highest seas were 12.0 meters (39 feet) at 0000 UTC on the 5th. The cyclone then moved through the southern Bering Sea and reformed in the Gulf of Alaska after the 5th.
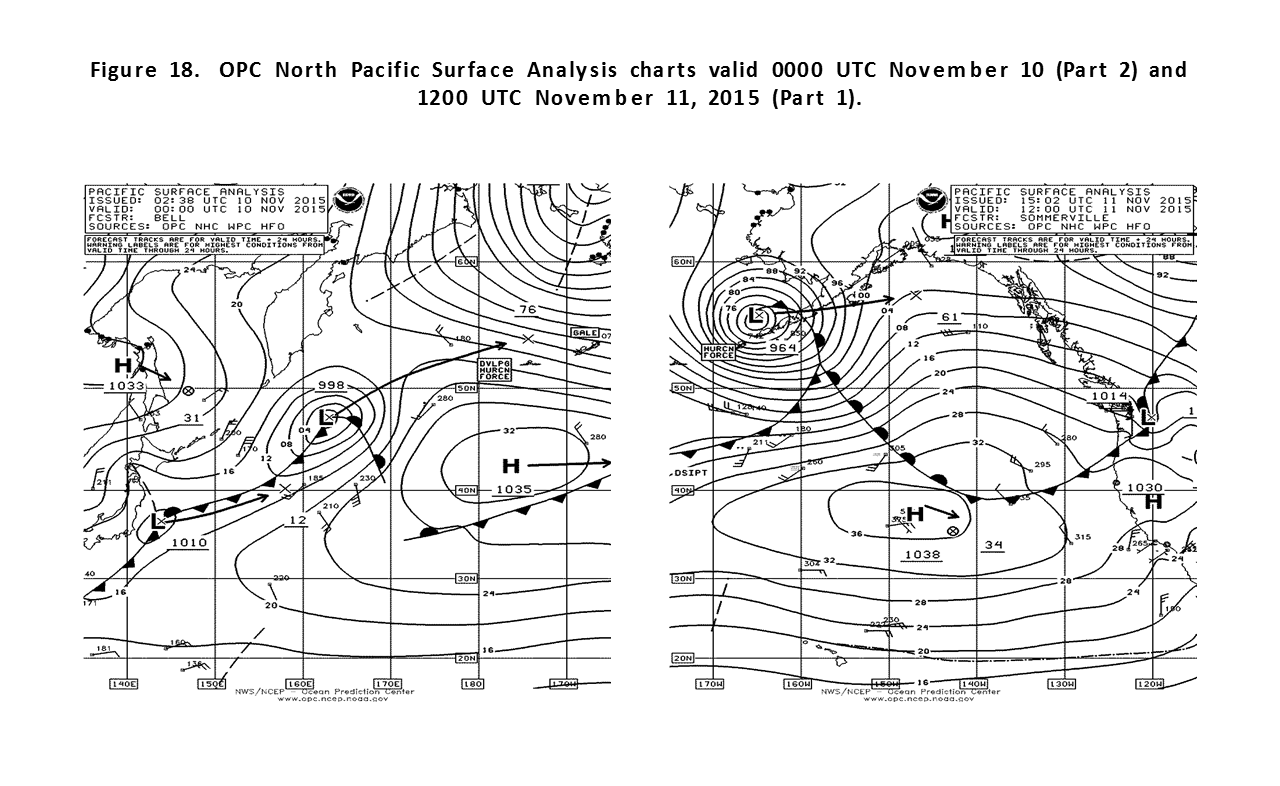
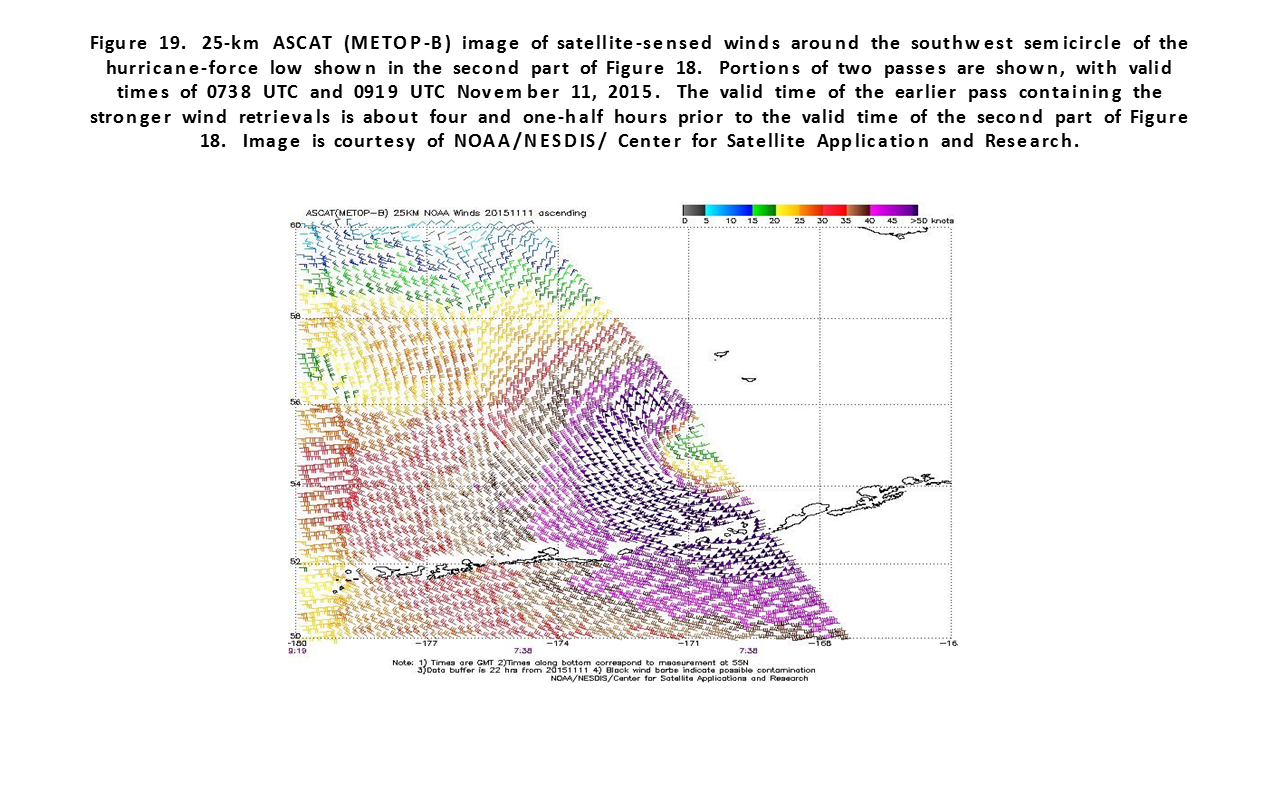
North Pacific and Bering Storm, November 8-12: Low pressure originating in the Sea of Japan early on November 8th moved northeast and then east in the Bering Sea. It later reformed in the Gulf of Alaska. The lowest central pressure fell to 960 hPa at1800 UTC on the 12th. Figure 18 shows the development of this system over a 36 hour period. The ASCAT-B data in Figure 19 reveal winds 50 to 60 kt in the southwest semicircle. The APL Belgium (WDG8555) near 53N 177W reported northwest winds of 65 kt at 0000 UTC on the 11th. The Maersk Danang (A8PS5) encountered west winds of 63 kt and 8.5 meter seas (28 feet) at 0000 UTC on the 12th. Buoy 46075 (53.9N 160.8W) reported west winds 47 kt with gusts to 64 kt and 14.0 meter seas (46 feet).
North Pacific and Bering Storms, November 17-23: A pair of strong lows moved from near northern Japan to the Bering Sea and then to the west coast of Alaska. The first briefly developed hurricane force winds with a 970 hPa central pressure near 54N 170E at 1800 UTC on the 18th. The central pressure dropped 36 hPa in the 24 hour period ending at 1200 UTC on the 18th. The system then weakened in the central Bering Sea and moved inland over western Alaska on the 20th. The second cyclone moved through the Bering Sea on the 22nd and 23rd and developed a lowest central pressure of 966 hPa in the western Bering Sea before weakening and moving inland. The ship DLYL2 (49N 168W) reported south winds of 55 kt and 6.7 meter seas (22 feet) at 0000 UTC on the 23rd.
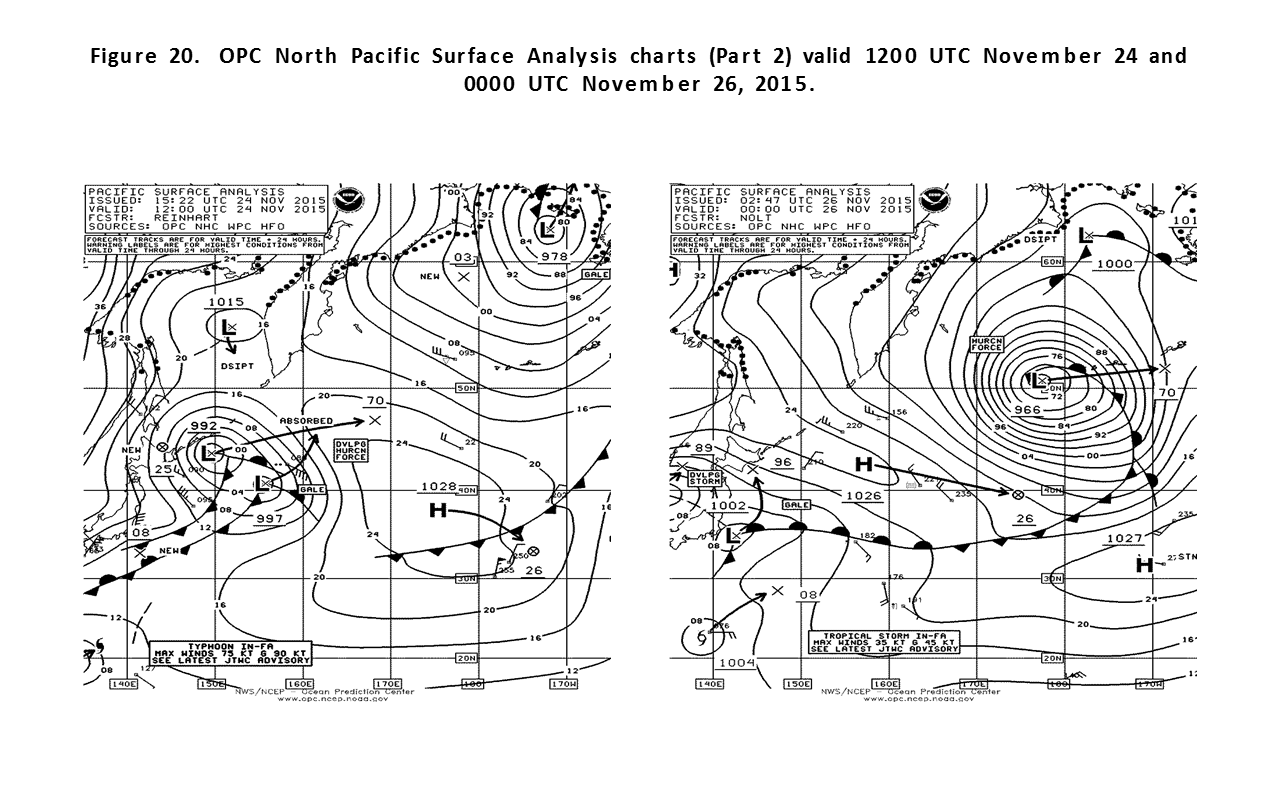
North Pacific Storm, November 24-26: A complex area of low pressure near Japan consolidated while intensifying over a 36 hour period as depicted in Figure 20, with the resulting intense low taking a track farther south than other cyclones in November, The central pressure initially fell 34 hPa in the 24 hour period ending at 0000 UTC on the 25th, when the system developed hurricane force winds. An ASCAT (METOP-B) pass from 2141 UTC on the 25th returned winds of 50 to 60 kt south of the low center but with a swath of missing data. The Wehr Singapore (V7ZG7) near 42N 157E reported west winds of 55 kt at 1800 UTC on the 24th. The system subsequently headed for the Gulf of Alaska while weakening.
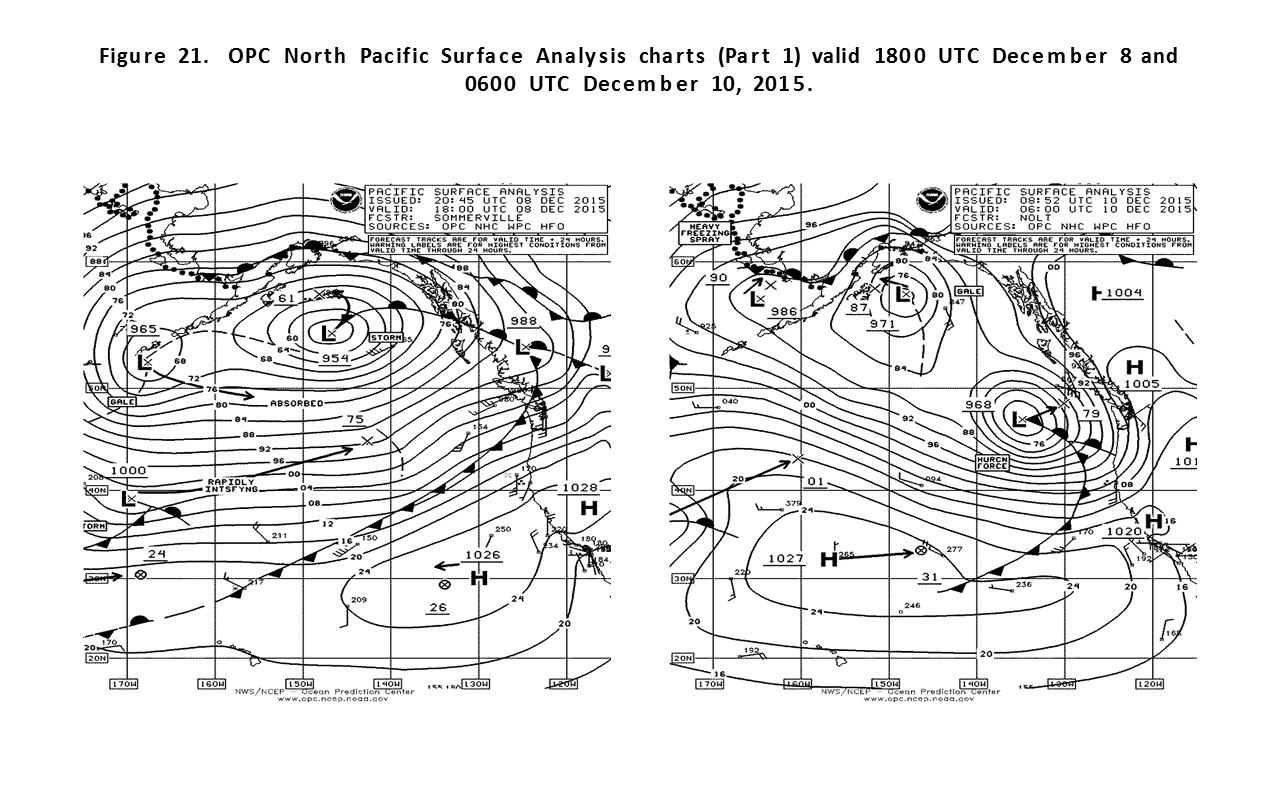
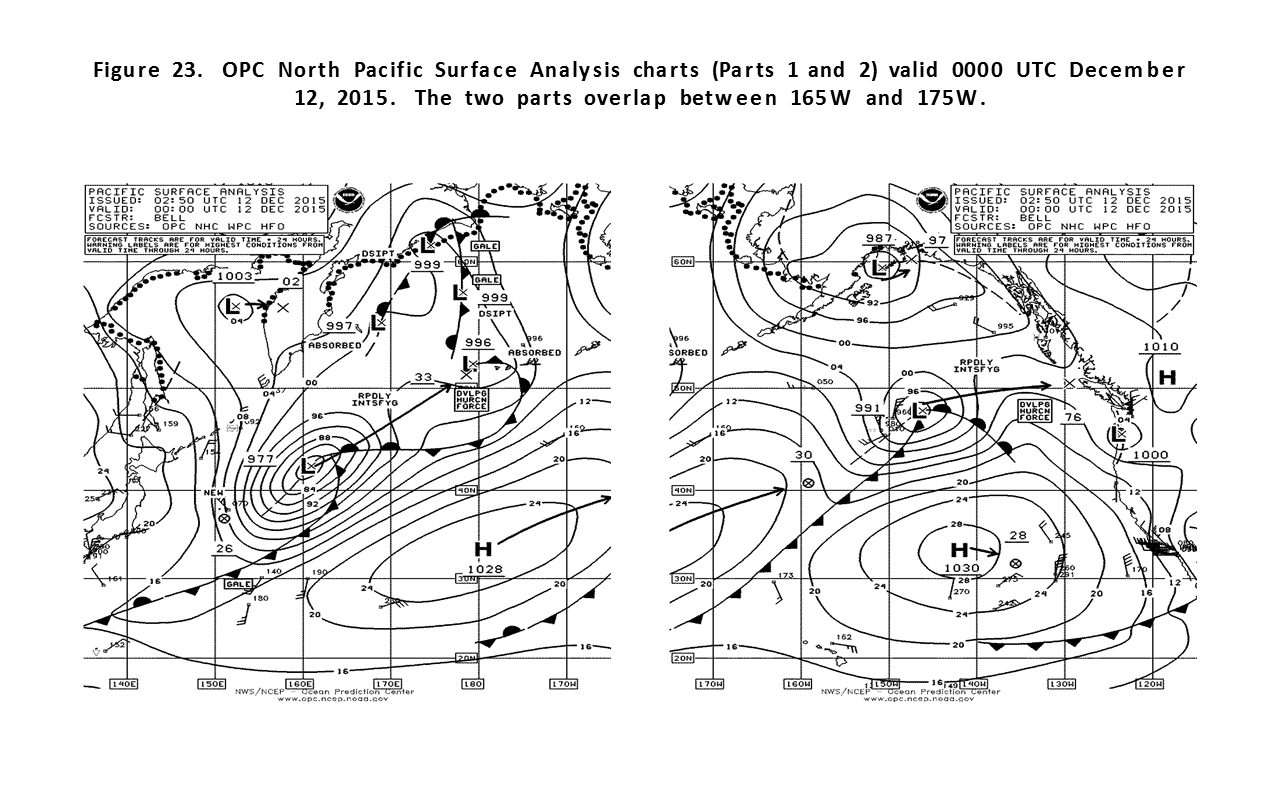
Eastern North Pacific Storm, December 8-11: Low pressure originating off Northern Japan early on December 7th tracked rapidly east southeast before turning more northeast in the eastern waters and rapidly intensifying (Figure 21). The cyclone developed a lowest central pressure of 966 hPa at 1200 UTC on the 10th with hurricane force winds. The ASCAT pass in Figure 23 reveals a swath of northwest winds 50 to 60 kt south of the cyclone center. Buoy 46002 (42.6N 130.5W) reported west winds of 41 kt with gusts to 56 kt and 12.0 meter seas (39 feet) at 1100 UTC on the 10th and highest seas 13.0 meters (43 feet) two hours later. The system then moved inland over the Pacific Northwest on the 11th.
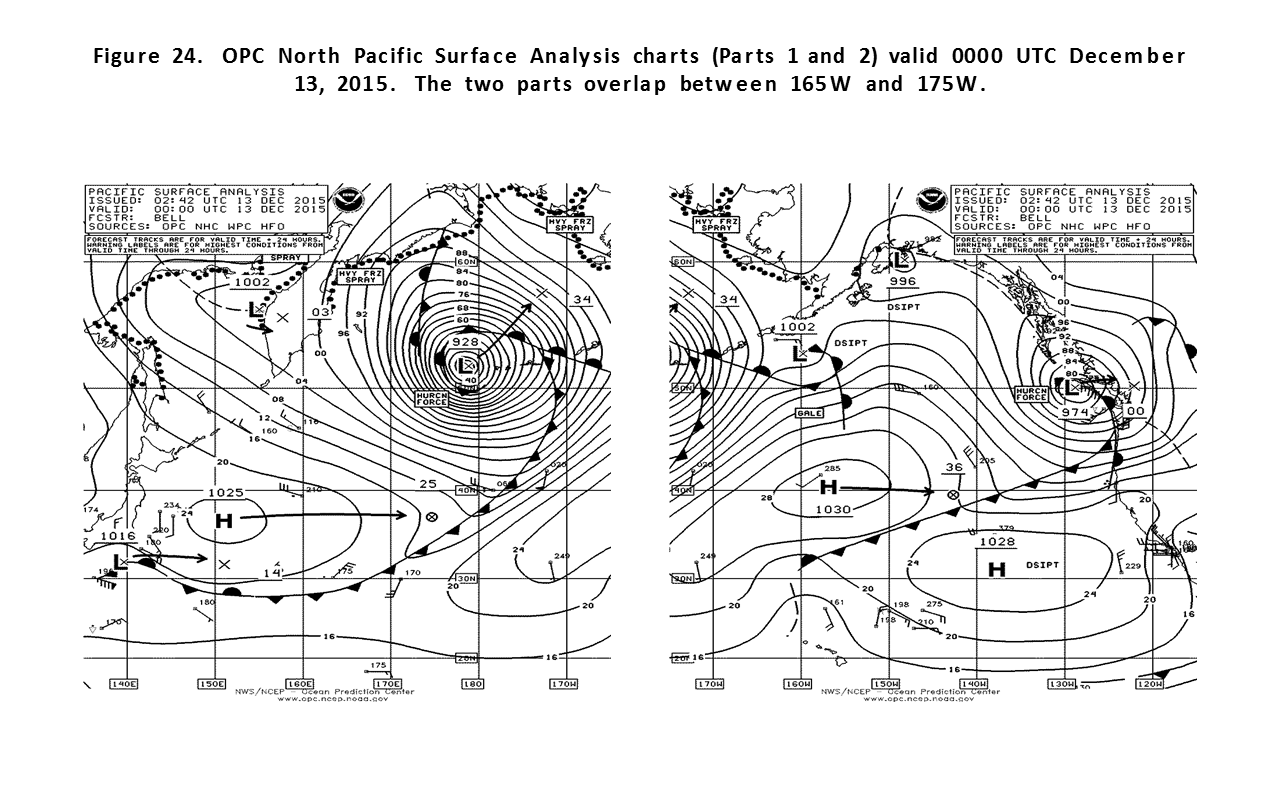
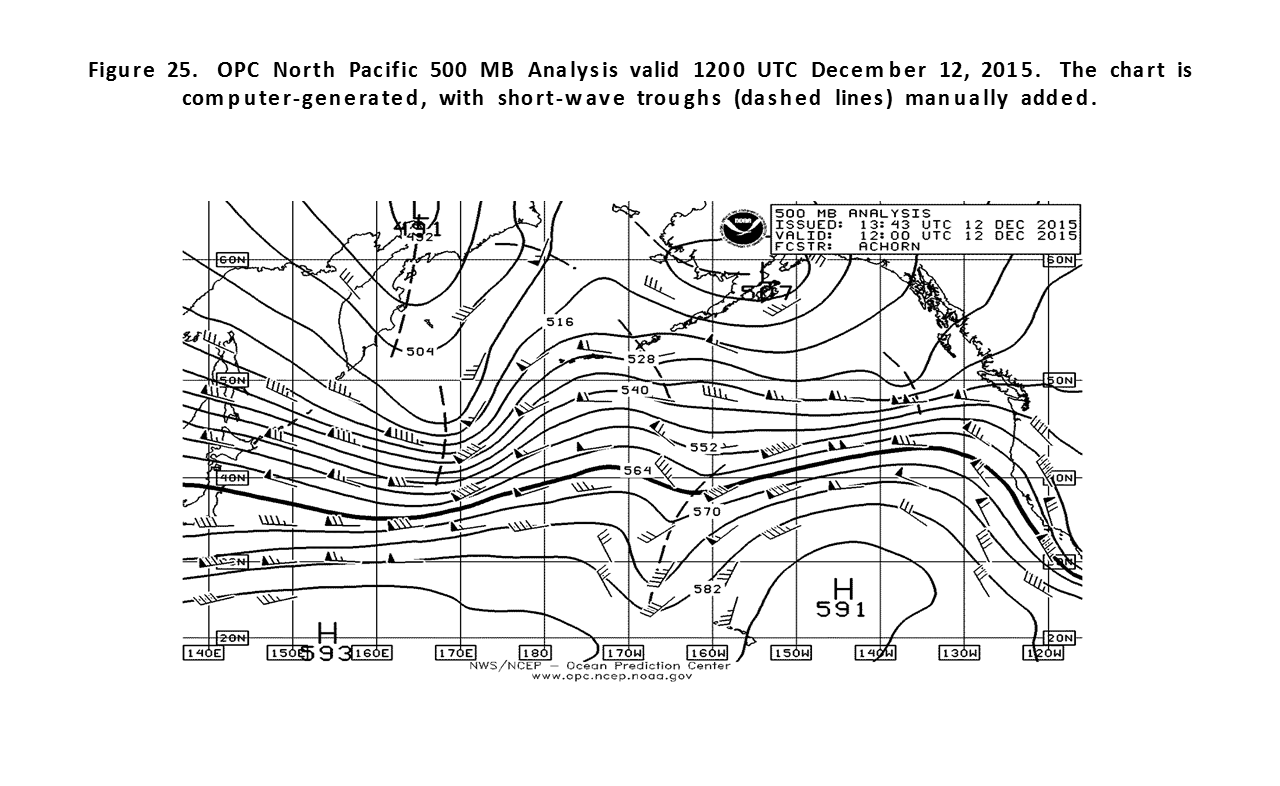
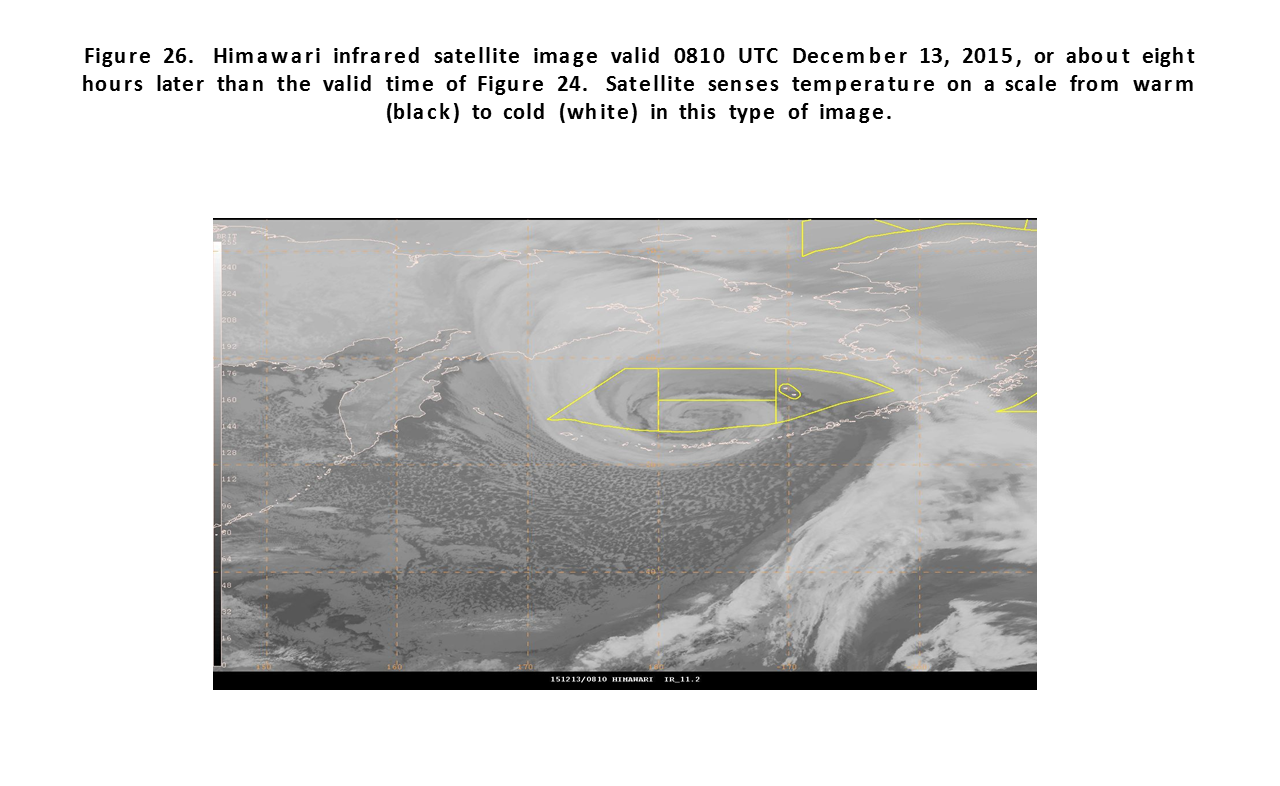
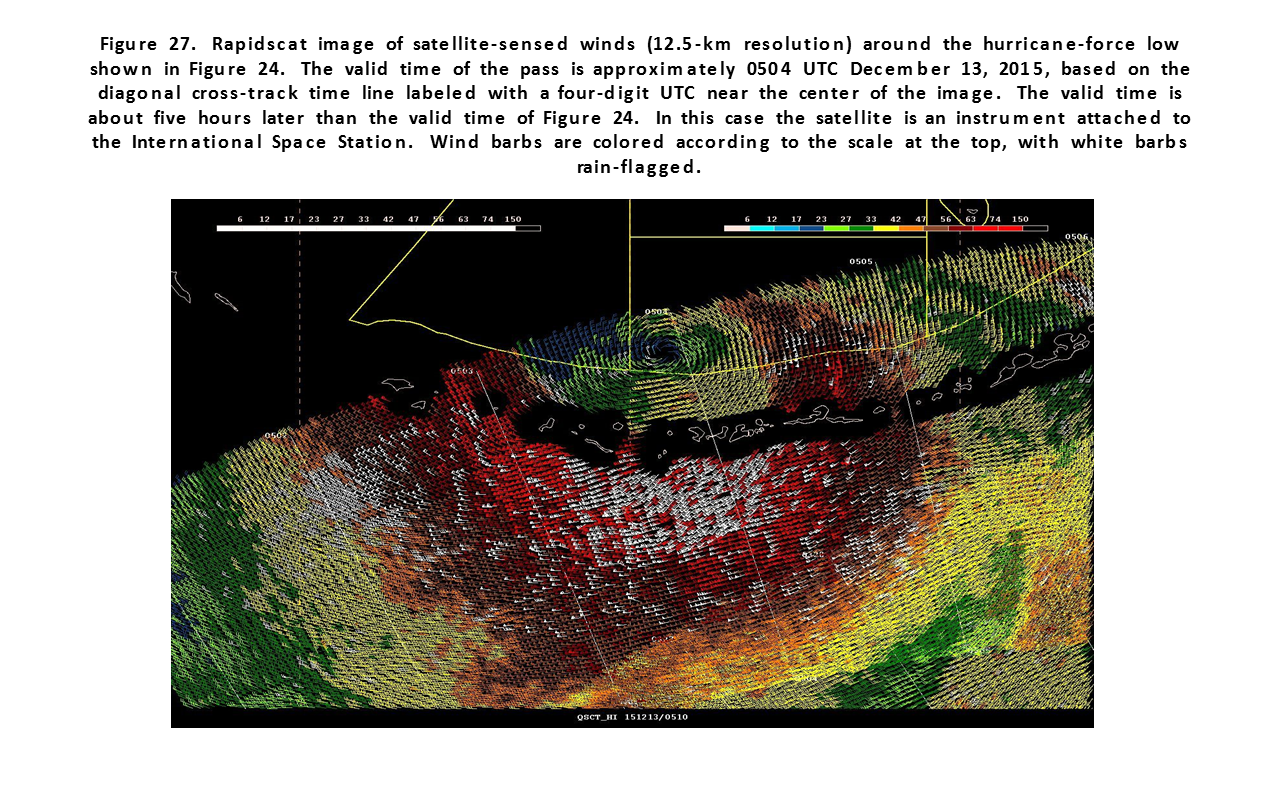
Intense North Pacific and Bering Storm, December 10-15: Figure 23 and Figure 24 depict the final 24 hours of development of this major event, which originated south of Japan. The central pressure fell 49 hPa in the 24 hour period ending at 0000 UTC on the 13th, or twice the "bomb" rate at 60N (Sanders and Gyakum, 1980), The central pressure reached 924 hPa six hours later, matching the record Nuri event of November 2014. The 500 millibar analysis in Figure 25 falls in the middle of the period of rapid intensification and shows two short wave troughs about to phase and reinforce each other, and develop negative tilt. More information on use of the 500 millibar chart may be found in the References (Sienkiewicz and Chesneau, 2008). Figure 26 is an infrared satellite image of the fully developed cyclone, with well-defined and cold cloud features. Figure 27 is a Rapidscat image of the system with hurricane force wind retrievals colored light red. Adak, Alaska in the central Aleutians reported southwest wind of 82 kt with gusts to 106 kt at 0916 UTC on the 13th and a pressure of 27.73 inches at 0416 UTC on the 13th. The buoy 46072 (51.7N 172.2W) reported 16.0 meter seas (53 feet) at 0900 UTC on the 13th. At 0500 UTC on the 13th the same buoy reported southwest winds of 45 kt with gusts to 64 kt and 10.0 meter seas (33 feet). The cyclone subsequently drifted northeast and slowly weakened through the 15th.
Eastern North Pacific Storm, December 11-13: An event similar to December 8th -11th occurred simultaneously with the intense North Pacific and Bering event. (Figure 23 and Figure 24). It originated in the southwest waters late on the 8th and tracked east northeast to near Vancouver Island by early on the 13th. An ASCAT pass from 1812 UTC on the 12th returned an area of west winds 50 to 60 kt south of the low center. The cyclone moved inland on the 13th.
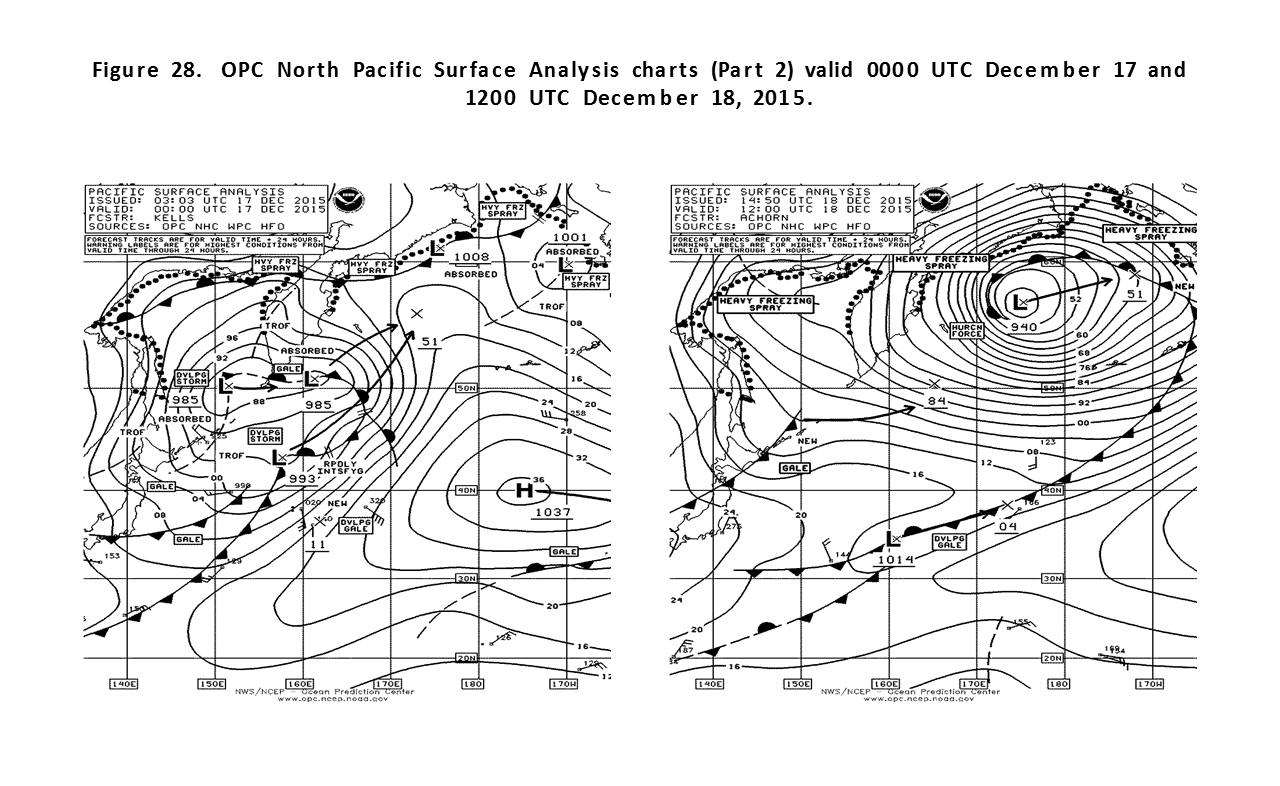
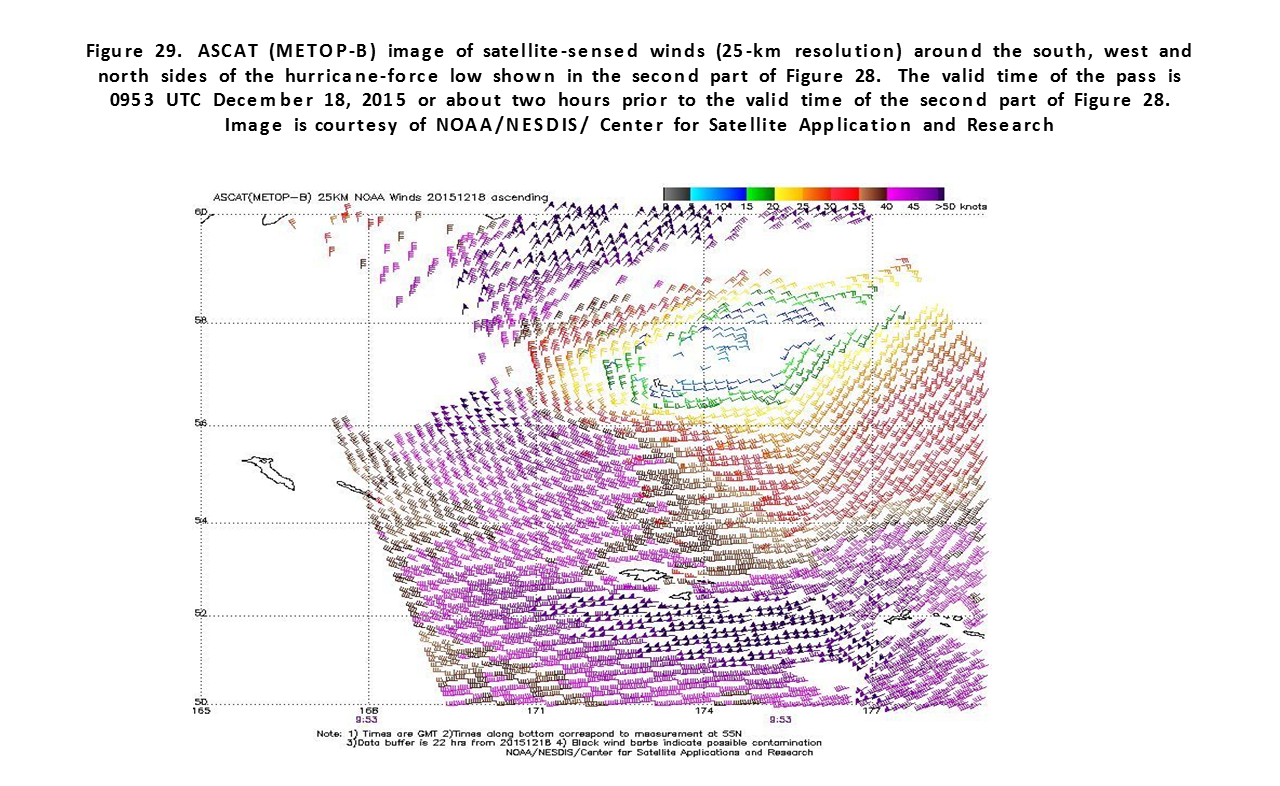
Northwest Pacific and Bering Storm. December 15-19: A complex system of low pressure areas consolidated and intensified over a 36 hour period to produce the large and intense Bering system (Figure 28). The central pressure fell 36 hPa in the 24 hour period ending at 0600 UTC on the 18th. The lowest pressure of 940 hPa (27.76 inches) makes this cyclone the second deepest of the four month period. The ASCAT-B image in Figure 29 reveals a sprawling system with the stronger winds of 50 to 55 kt on the periphery. The buoy 46073 (55.0N/172.0W) reported 12.5 meter seas (41 feet) at 0800 UTC on the 19th. A weakening trend set in on the 18th, and the cyclone dissipated over southwest Alaska on the 20th.
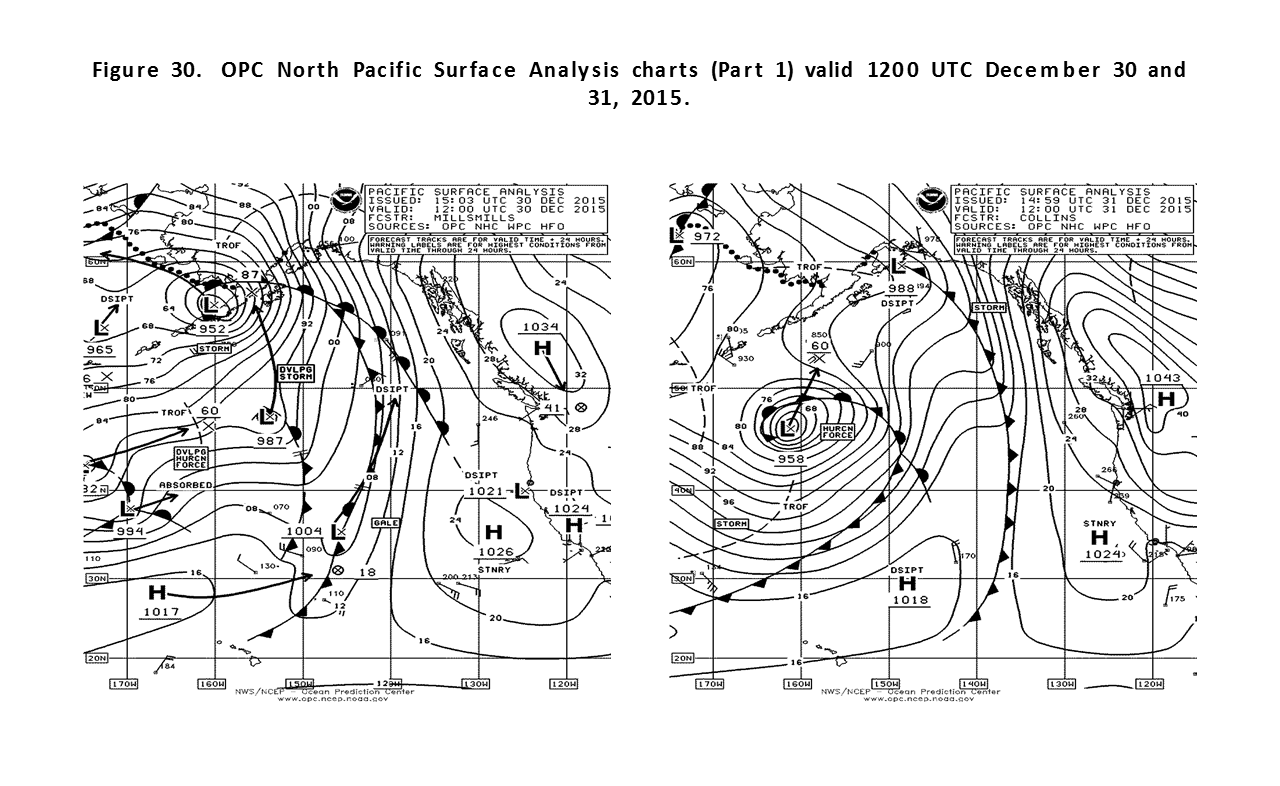
North Pacific Storm, December 30-January 1, 2016: A new low formed in the south central waters near 37N 178E and tracked east northeast while rapidly intensifying. The central pressure fell 33 hPa in the 24 hour period ending at 0000 UTC on the 31st. Figure 30 shows the system near maximum intensity and relatively compact with hurricane force winds. ASCAT winds with this system appear similar to Figure 16 for the October 10th -12th event. The Horizon Anchorage ( KGTX) reported southeast winds of 60 kt near 53N 147.3W at 1200 UTC January 1st. The cyclone subsequently drifted north with slow weakening into early January.
References
1. Sanders, Frederick and Gyakum, John R., Synoptic-Dynamic Climatology of the "Bomb", Monthly Weather Review, October 1980.
2. Ocean Surface Winds, http://manati.star.nesdis.noaa.gov/products.php
3. VonAhn, Joan. and Sienkiewicz, Joe, "Hurricane Force Extratropical Cyclones Observed Using QuikSCAT Near Real Time Winds", Mariners Weather Log, Vol. 49, No. 1, April 2005.
4. Saffir-Simpson Scale of Hurricane Intensity: http://www.nhc.noaa.gov/aboutsshws.php
5. Tropical Cyclone Reports, 2015, National Hurricane Center, http://www.nhc.noaa.gov/data/tcr/index.php?season=2015&basin=atl
6. Bancroft, George, "Marine Weather Summary, North Pacific Area, September 2014 to February 2015", Mariners Weather Log, December 2015.
7. Sienkiewicz, Joe and Chesneau, Lee, "Mariner's Guide to the 500-Millibar Chart", Mariners Weather Log, December 2008.
8. http://www.mashable.com/2015/12/28/Freak-atlantic-storm-uk-Frank/#V5Ew
Back to top