Mean Circulation Highlights and Climate Anomalies May through August 2014
Anthony Artusa, Meteorologist, Operations Branch, Climate Prediction Center NCEP/NWS/NOAA
All anomalies reflect departures from the 1981-2010 base period.
January-February 2015
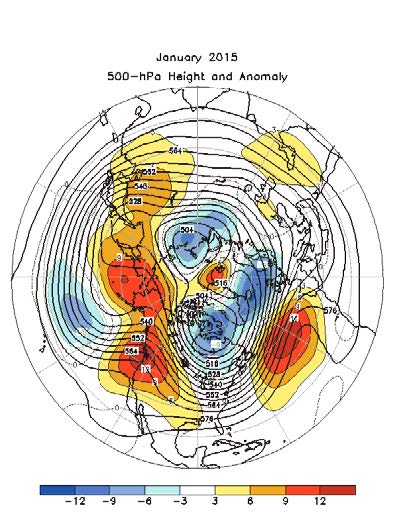
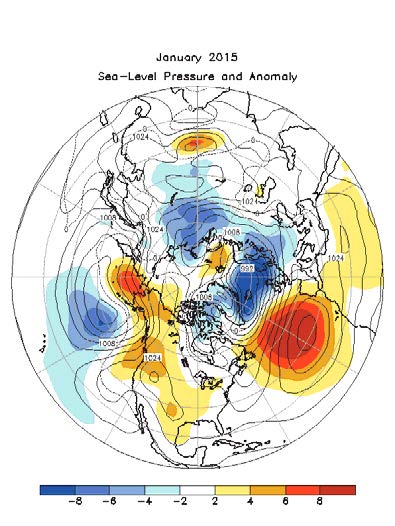
The mean 500 hPa circulation during January 2015 featured positive height anomalies from East Asia across the Bering Sea to most of western North America and over the mid-latitude North Atlantic. Negative height anomalies prevailed across eastern Canada, the northern North Atlantic, north-central Russia, and just north of Hawaii in the North Pacific (Figure 1). The corresponding sea level pressure (SLP) and anomaly map (Figure 2) featured near to below normal SLP over East Asia (despite notable above normal mid-tropospheric heights), and a positive North Atlantic oscillation (NAO) characterized by abnormally low SLP from Baffin Island, Canada, to northern Europe and abnormally high SLP across the mid-latitude North Atlantic.
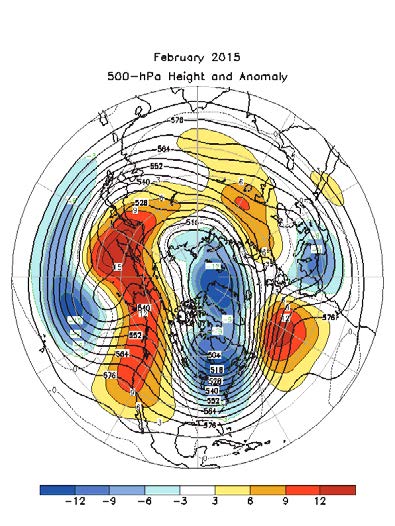
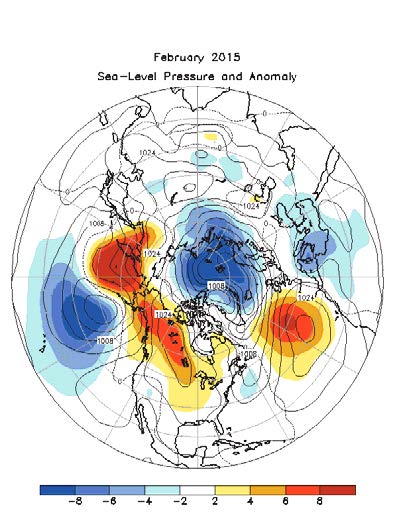
During February, a highly amplified mid-tropospheric flow pattern developed over North America, with ridging well above normal; 500 hPa heights over the western half of the continent, and troughing. Well below normal; 500 hPa heights observed over the eastern half of the continent. Well below normal heights were also observed over the North Pacific (mostly between Hawaii and Alaska), from Greenland and Spitsbergen to the Russian island of Novaya Zemlya, and across most of the Mediterranean Sea. Well above normal heights were also noted over northeast Asia, western Russia, and the North Atlantic between about the 30th and 60th parallels (Figure 3). The corresponding SLP and Anomaly map depicts a similar pattern that generally matches the mid-tropospheric configuration in anomaly sign. However, one area that shows clear disagreement is eastern North America, where near to above normal SLP prevailed, despite the presence of a 500 hPa trough (Figure 4).
The Tropics
Sea surface temperatures (SST) were above average in the central and western equatorial Pacific in January and February and below average in the eastern Pacific in January. The latest monthly El Nino index for the El Nino 3.4 region was +0.5C (January) and +0.6C (February). The depth of the oceanic thermocline (measured by the depth of the 20C isotherm) remained close to average. However, an extensive area of positive subsurface anomalies was noted near the Date Line. Negative subsurface anomalies prevailed closer to the surface, east of 110W. . In February, the thermocline was deeper than usual across the central and east central equatorial Pacific, with subsurface anomalies ranging from 1-4C above average. Equatorial low level easterly trade winds remained near average in January, and weaker than average in February. Tropical convection was enhanced across Indonesia and the western Pacific in January, and primarily the western Pacific in February. Suppressed convection was observed near the Date Line (January), and over the east-central Pacific (February). Collectively, these oceanic and atmospheric anomalies reflect ongoing ENSOneutral conditions.
March-April 2015
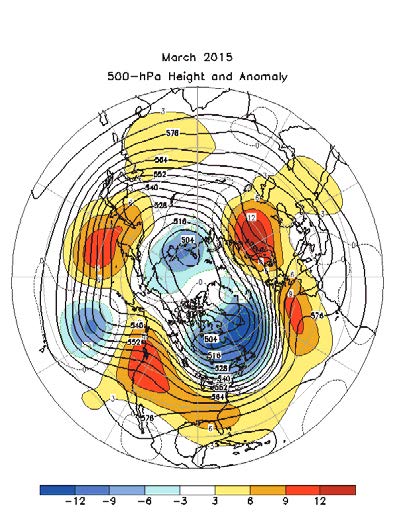
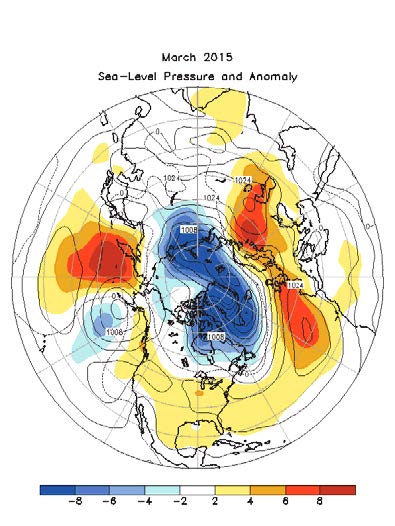
In March, a positive Arctic Oscillation (AO) dominated the northern hemispheric circulation, with above normal 500 hPa heights over the middle latitudes, and below normal 500 hPa heights over the polar region (Figure 5). The one exception was a very persistent trough and its associated negative 500 hPa height anomalies just north of Hawaii; a feature also observed during the previous two months. The SLP and anomaly map generally reflected the mid-tropospheric height anomaly pattern (Figure 6).
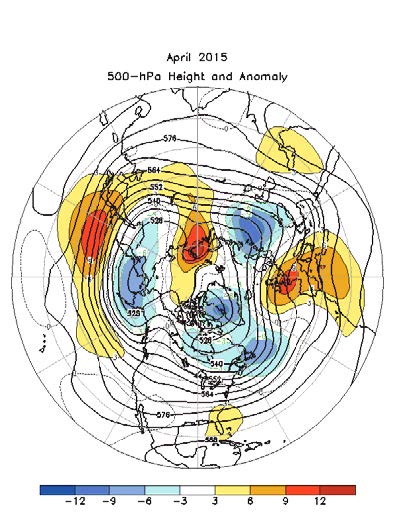
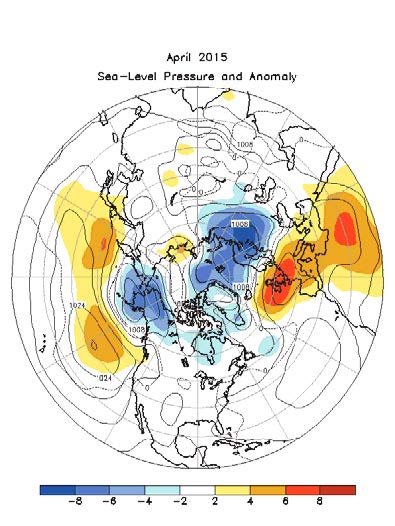
The mean 500 hPa circulation during April 2015 was characterized by a pole ward shift of the height anomaly pattern, which is a sign of the approaching warm season. Below normal 500 hPa heights were noted over the Bering Sea/Alaska domain, eastern Canada including the Grand Banks region, Greenland and northwestern Russia (Figure 7). Above normal heights were observed across Western Europe and portions of North Africa, north-central Russia, and from Japan eastward across the western Pacific to about the Date Line. The SLP and anomaly map generally mirrors the mid-tropospheric pattern (Figure 8).
The Tropics
A waning neutral ENSO transitioned to a weak Nino during March and April 2015. Sea surface temperatures (SST) were above average in the western and central equatorial Pacific (March) and above average in most areas of the equatorial Pacific (April). The latest monthly Nino indices for the Nino 3.4 region were +0.6C (March) and +0.8C (April). The depth of the oceanic thermocline (as measured by the a 20C isotherm) was above average in the central and east-central Pacific during March, and the eastcentral and eastern equatorial Pacific during April. Subsurface temperature anomalies exhibited a large range, from 1-5C warmer than average (March) and 1-6C warmer than average (April). Low level westerly wind anomalies prevailed across the western Pacific in March, and most of the equatorial Pacific in April. Deep tropical cloudiness and thunderstorm activity was enhanced over the central equatorial Pacific during the two-month period.
References
Much of the information used in this article originates from the Climate Diagnostics Bulletin archive: (http://www.cpc.ncep.noaa.gov/products/CDB/CDB_Archive_html/CDB_archive.shtml)
Back to top